Figure 1.

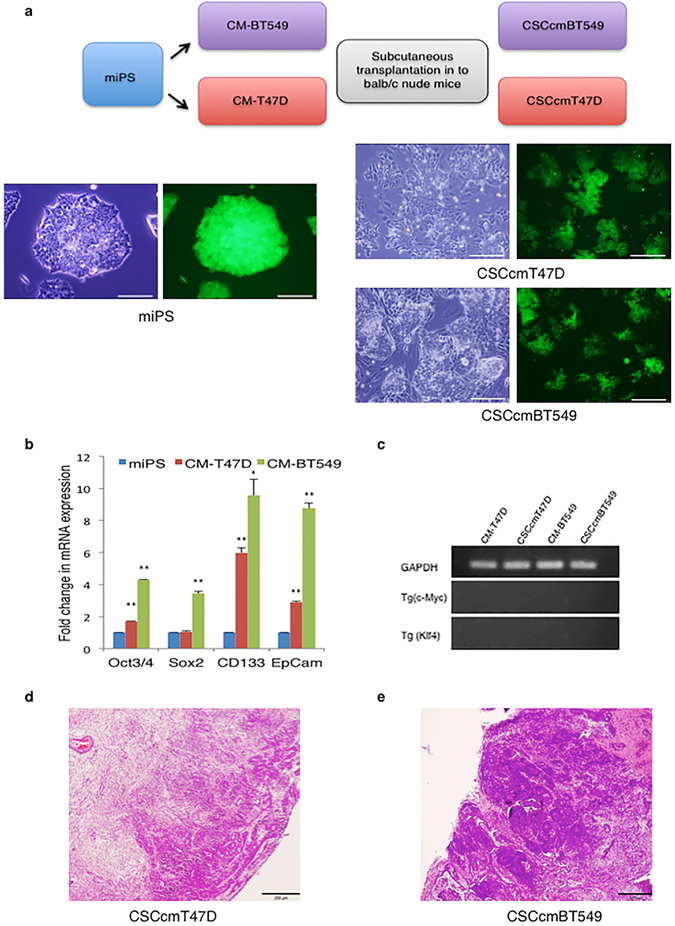
Differentiation of miPS cells into CSCs. (a) Schematic flow chart of CSC generation. Detailed description is in the text. Representative images of miPS cells, and CSCcmT47D and CSCcmBT549 cells. Images of unstained cells and GFP-positive cells from identical fields of view are shown side by side. Scale bars represent 200 μm. (b) RT-qPCR analysis of the CSC markers CD133, Epcam, Oct3/4, and Sox2 in CM-T47D and CM-BT549 cells after 4 weeks in CM. Gene expression levels were normalized to those of GAPDH, and relative gene expression levels in CM-T47D or CM-BT549 cells were compared with those in untreated miPS cells. (c) RT-qPCR analysis of the Klf4 and c-Myc transgenes in CM-T47D and CM-BT549 cells after four weeks in CM, and in primary CSCcmBT549 and CSCcmT47D cells generated from subcutaneous tumors. An image of an agarose gel with the RT-qPCR products demonstrates the absence of Klf4 and c-Myc expression. The data were analyzed using an unpaired two-tailed Student’s t-test and are presented as the mean ± standard deviation **P < 0.01, *P < 0.05. (d and e) T47DCSCcm (d) and BT549CSCcm (e) primary subcutaneous tumors stained with hematoxylin-eosin. Scale bars represent 300 μm.
