
Figure 6.
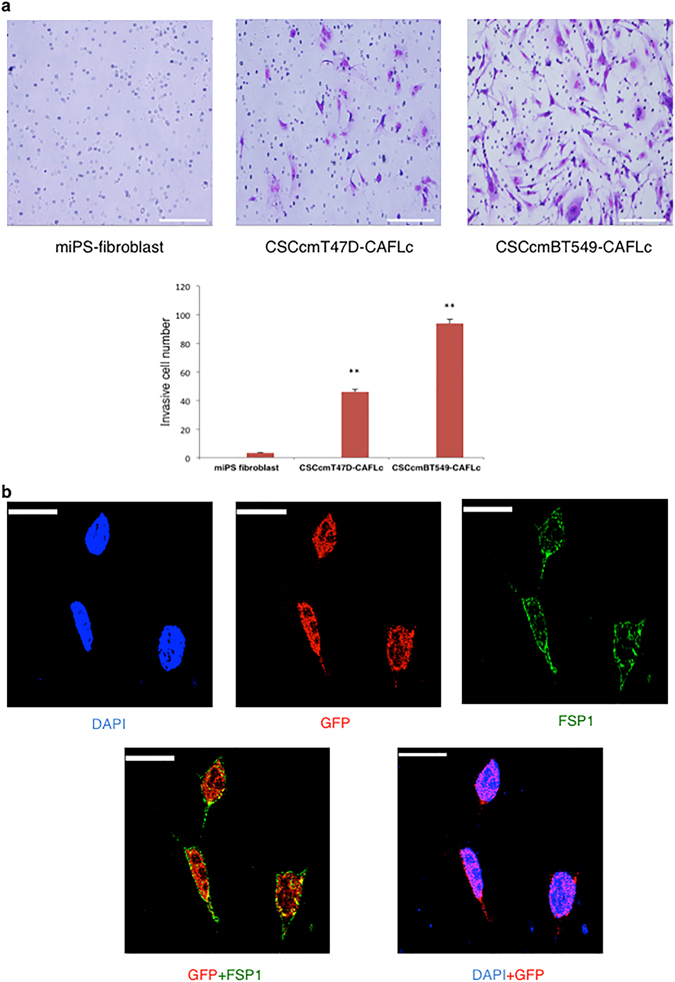
Assessing enhanced invasion potential and lineage tracing. (a) CAFLC invasion ability was measured using Matrigel-coated transverse inserts. Invasive cells were stained with Giemsa and quantitatively analyzed in several fields of view. The experiments were conducted in triplicate. Scale bar represents 200 μm. The graph indicates quantitative results by counting invasive cells. CSCcmT47D-CAFLCs and CSCcmBT549-CAFLCs were more invasive than control miPS-fibroblasts. The data were analyzed using an unpaired two-tailed Student’s t-test and are presented as the mean ± standard deviation. **P < 0.01, *P < 0.05. (b) In situ hybridization analysis using a probe targeting GFP (red) and immunofluorescence analysis of FSP1 (green). The strong GFP signal in the nucleus indicated that CAFs retained plasticity. Scale bar represents 10 μm.