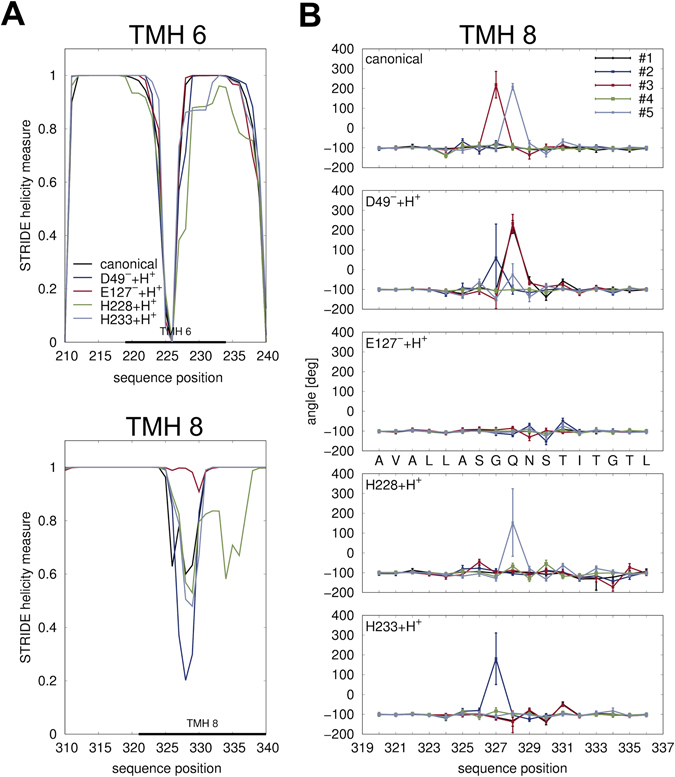
Figure 2.

Helicity changes upon protonation in ScaDMT. (A) Time average of helicity of each residue as observed in simulations of ScaDMT in various protonation states, quantified using STRIDE24. The indicated transmembrane regions were taken from the PDBTM database62. Regions with most differences in helicity are shown, which are TMH 6 (top) and TMH 8 (bottom). (B) Helicity changes in each MD trajectory were also quantitated by calculating the time average of the sum of dihedral angles ψ i + ϕ i+1 along the protein chain. For an ideal α-helix, this value is ≈−105°. Large values around 200° correspond to local peptide bond flips.
