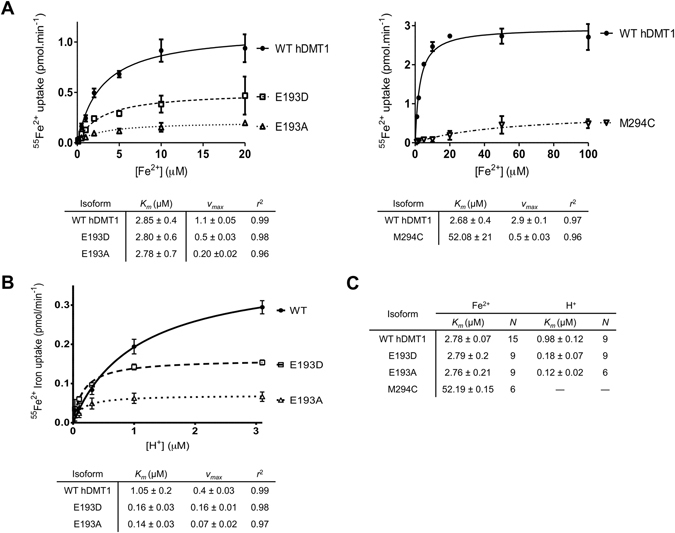
Figure 5.

Fe2+ and H+ saturation kinetics of WT hDMT1 and E193 and M294 mutants in stably transfected HEK293 cells. (A) Representative experiments of 55Fe2+ uptake kinetics by hDMT1 and E193 and M294 mutants as a function of increasing Fe2+ concentrations (0.1–20 µM). (B) Representative experiment of 55Fe2+ uptake kinetics by hDMT1 and E193 mutants as a function of increasing H+ concentration (pH 5.5–7.5). For each concentration of the substrate, the background uptake measured for the empty vector transfected HEK control cells was subtracted. Uptake values were also corrected according to their plasma membrane expression and represented as the mean ± S.D. A Michaelis-Menten equation (connecting lines) was fit to the data and the obtained kinetic parameters are summarized in a table below each graph. (C) Summary table of the apparent affinities for Fe2+ and H+ of hDMT1 and the indicated mutants. K m values were calculated from 2–3 independent experiments and are presented as means ± S.D.
