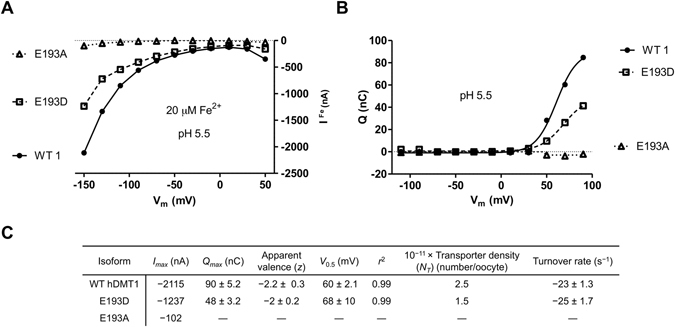
Figure 6.

Steady-state and pre-steady state currents for WT hDMT1 and E193 mutants expressed in X. laevis oocytes. (A) Current-voltage relationship (V h = −50 mV; pH 5.5; 20 μM Fe2+). (B) Q/V m relationship (V h = −50 mV; pH 5.5). Pre-steady state currents were integrated with time to obtain the charge Q and depicted at test potentials (V t) ranging from −110 mV to +90 mV. Corresponding curves on panels A and B were recorded in the same oocytes, which were obtained from the same batch. Similar results were observed in 7–10 oocytes from 3 different batches. (C) The maximal current evoked by 20 µM Fe2+ (Fig. 1A) was taken as I max. Pre-steady state parameters (Q max, z, V 0.5 and r 2) were derived from data in panel B by fitting a Boltzmann equation (connecting lines). The number of functional transporters (N T) expressed in the plasma membrane was determined as N T = Q max/z∙e (e = 1.6 × 10⁻¹⁹ C). Turnover rate was determined as −I max/Q max.
