Figure 2.

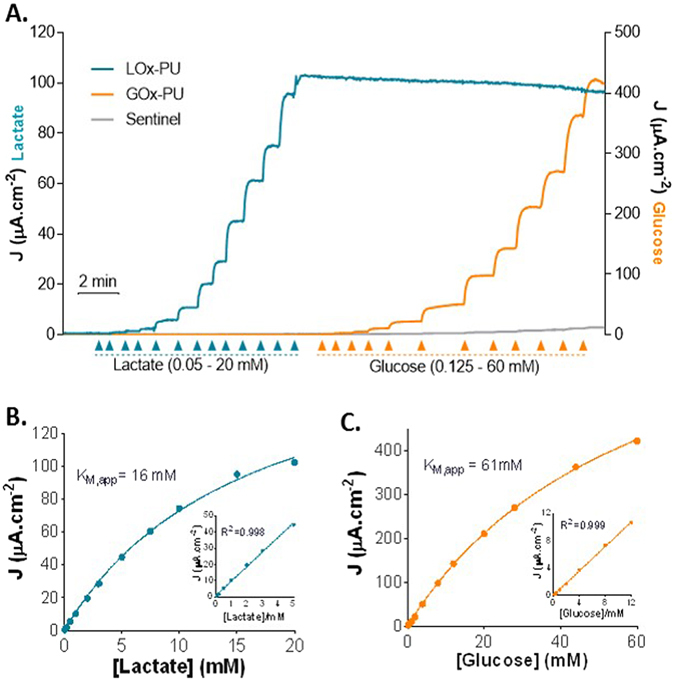
Enzyme kinetics of LOx-PU coated sites and GOx-PU coated sites towards lactate (blue line) and glucose (orange line) detection. Grey line represents the response of the sentinel site. (A) Representative calibration showing responses of LOx-GOx MBA to successive additions of lactate and glucose. The final concentrations after each addition was 0.05, 0.1, 0.2, 0.5, 1, 2, 3, 5, 7.5, 10, 15 and 20 mM for lactate and 0.125, 0.5, 1, 2, 4, 8,12, 20, 28, 44 and 60 mM for glucose. (B,C) Calibration plot of the average steady-state current as a function of lactate (B) and glucose (C) concentration. Data were fitted to the Michaelis–Menten equation by using non-linear regression analysis. Inserts: Linear regression of the response of the LOx-PU coated sites (B) and GOx-PU coated sites (C) to lactate and glucose, respectively.
