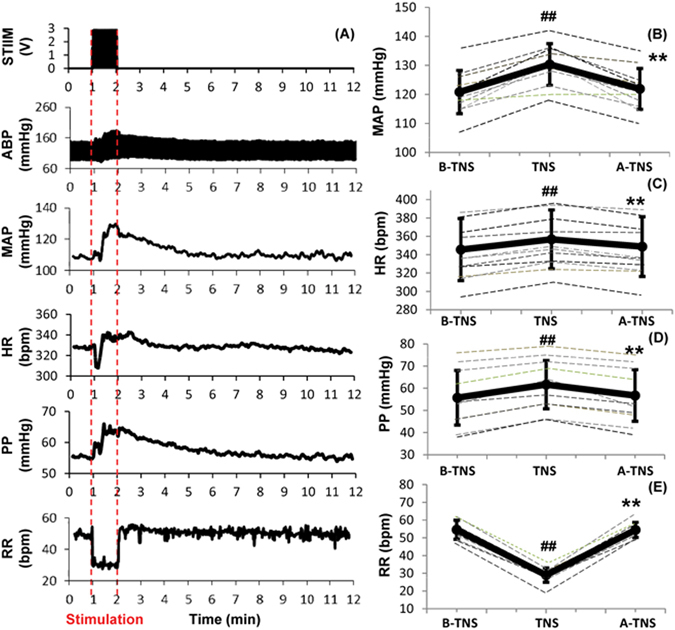
Figure 4.

Effects of subcutaneous trigeminal nerve stimulation (TNS) on hemodynamics. (A) Representative changes in MAP, HR, PP and RR. (B) MAP increased significantly with TNS. (C) HR increased slightly with TNS. (D) PP increased with TNS. (E) RR decreased significantly. Data were expressed as mean ± SD and analyzed using repeated measures ANOVA. #p < 0.05 vs baseline, ##p < 0.001 vs baseline, *p < 0.05 vs TNS, **p < 0.001 vs TNS, n = 12/group. B-TNS: 1-min before trigeminal nerve stimulation; TNS: during 1-min trigeminal nerve stimulation; A-TNS: 10-min after trigeminal nerve stimulation.
