Figure 2.

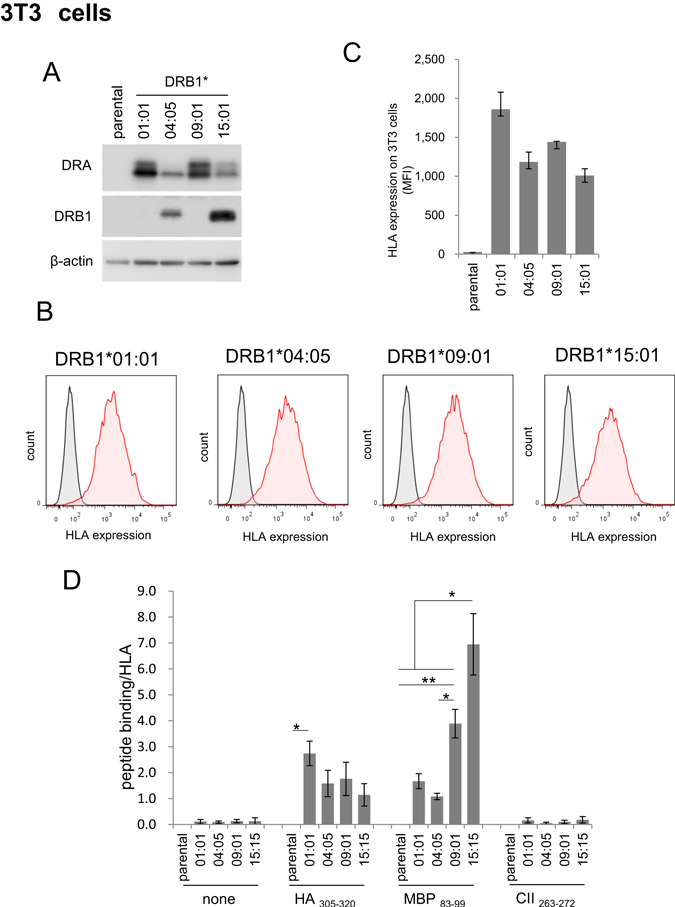
Stable expression of HLA molecules and binding to various antigen peptides in murine 3T3 cells. (A) Western blot analysis of HLA-DR expression levels in various HLA-expressing 3T3 cells. (B,C) FACS analysis of cell-surface expression of HLA-DR molecules in 3T3 cells. The grey peak and pink peak represent untransfected control cells and respective DRB1 transfected cells, respectively. The graph shown is a summary of the FACS results of two independent measurements and expressed as mean ± range (C). Western blotting and peptide binding assay were performed, and one representative result is shown. (D) Summary of the relative binding affinity of various HLA-DR and antigen peptides. Peptide binding assay was carried out in various HLA-expressing 3T3 cells (Supplementary Fig. 2). For each peptide group, peptide binding/HLA was calculated by subtracting the MFI value for the parental 3T3 cells from individual MFI. Then, the net MFI values were divided by the respective MFI value for HLA expression levels (Fig. 2C). The values are mean ± inter-assay deviation expressed as SEM of three independent experiments. Statistical significance is as follows: *P < 0.05 and **P < 0.01.
