Figure 2.

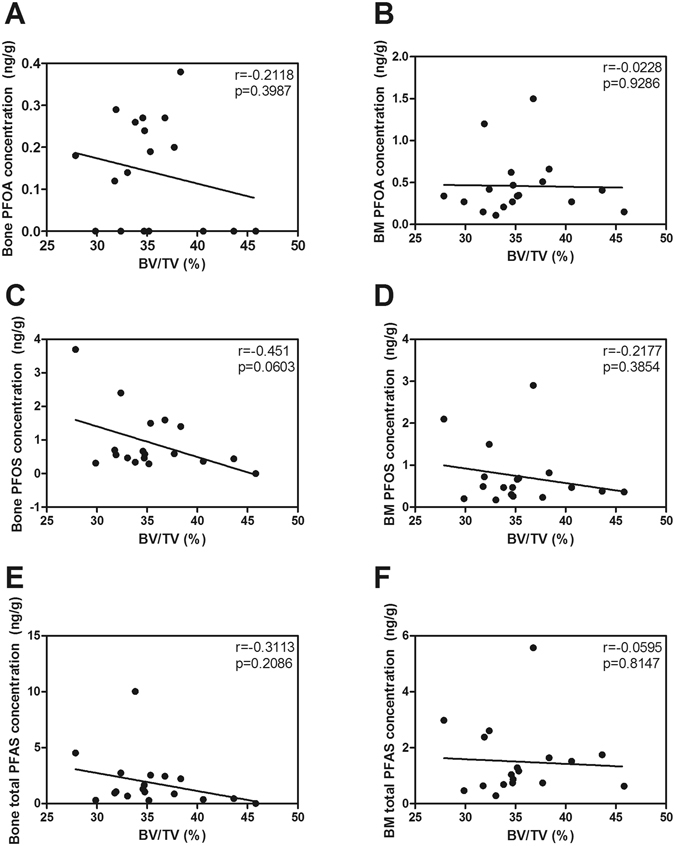
Dependence of bone volume/tissue volume (BV/TV) (A–D,G–H) and age (E–F) on concentrations of PFOA (A,B), PFOS (C,D) and total PFAS (E–H) in bone (left panel) and bone marrow (right panel). Linear correlations with r and p values.

Dependence of bone volume/tissue volume (BV/TV) (A–D,G–H) and age (E–F) on concentrations of PFOA (A,B), PFOS (C,D) and total PFAS (E–H) in bone (left panel) and bone marrow (right panel). Linear correlations with r and p values.