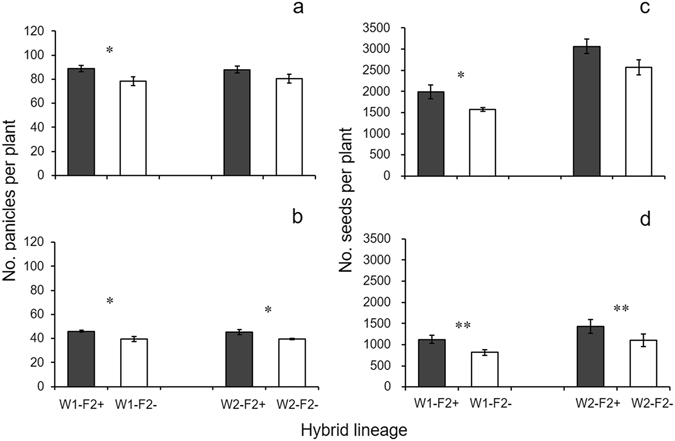
Figure 3.

Number of panicles (a, b) and filled seeds (c, d) per plant of F2 transgenic (dark grey columns) and non-transgenic (white columns) crop-wild hybrid lineages in pure-planting (a, c) and mix-planting plots (b, d). The comparisons were made between transgenic and non-transgenic F2 hybrid lineages in mix planting (30 cm) based on paired t-test (N = 6). Bars represent standard error. * or ** indicates significances at the levels of P < 0.05 or P < 0.01, respectively.
