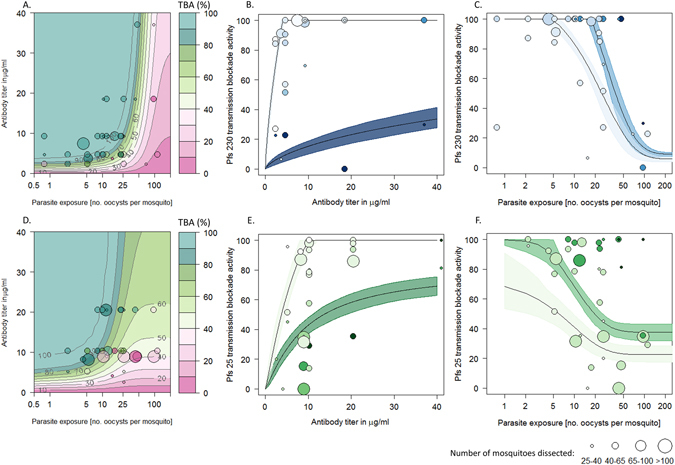
Figure 1.

A comparison of transmission blocking activity (percentage reduction in the number of infected mosquitoes, TBA) for anti-Pfs230 (ABC) and anti-Pfs25 (DEF) antibodies. In all panels point size is proportional to the number of mosquitoes dissected. Panel (A) and (D): 3D model predictions for TBA depending on antibody specific titer and parasite exposure (as measured by the mean number of oocyst in the control group). Contour lines and colors show the best fit model for TBA which can be compared to the observed estimates (colors match contour plot). Panels (B) and (E) show the same model on a 2 dimensional plane illustrating how TBA varies with antibody titer. Solid lines indicating the best fit model whilst shaded regions show 95% confidence intervals around the best fit lines. The color of the shaded regions and points indicates the level of parasite exposure (darkest shades match highest exposures: for the two lines light shading = 5 oocysts/mosquito and dark shading = 100 oocysts/ mosquito). Panel (C) and (F): The same model showing how TBA changes with parasite exposure (best fit model with 95% confidence intervals) for two antibody titers. Point and area shading denote antibody titer (darkest shades match highest titers: light shade and dark shade respectively show model predictions for low (4 µg/ml) and high (40 µg/ml) titers).
