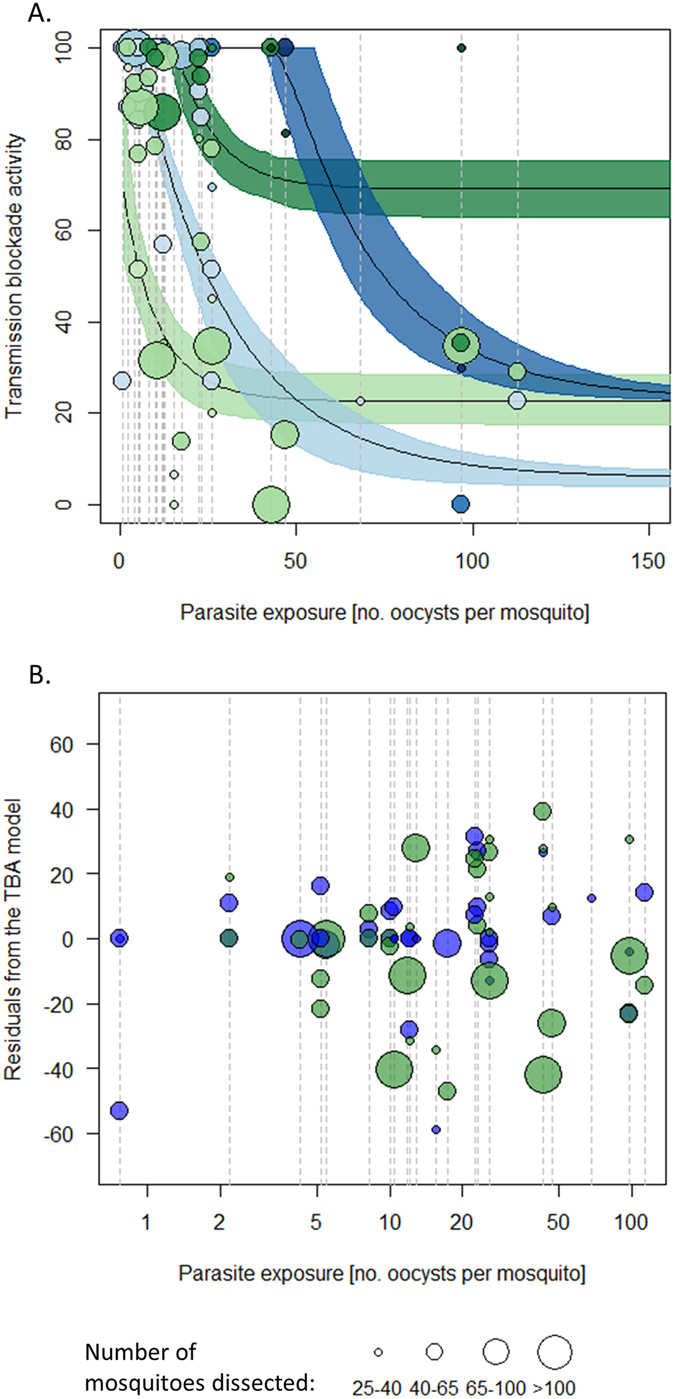
Figure 2.

(A) An illustration of how transmission blocking activity (TBA) varies with parasite exposure for the two antibodies under investigation and (B). Residuals of the TBA model for experiments testing anti-Pfs230 (blue) and anti-Pfs25 (green) antibodies. In both panels vertical dashed line indicate assays run using the same parasite isolate (infected blood donated from an individual volunteer); green and blue colors indicate experiments testing TBA of anti-Pfs25 and anti-Pfs230 antibodies respectively. In (A), predictions for two titers are given, for 4 µg/ml of target-specific IgG (light colors) and 40 µg/ml of target-specific IgG (dark colors). Point shading indicates antibody titer. Care should be taken when interpreting the difference between the lines as both are fit using relatively few data points (especially at high levels of parasite exposure). In (B), each data point shows the distance from the observed data to the best fit model (taking into account differences in titer and exposure). A value of zero would indicate the model fitted the data perfectly. The symmetrically of the points either side of the line for each blood donor indicates that it is not always the parasite isolate having higher or lower TBA than predicted by the model.
