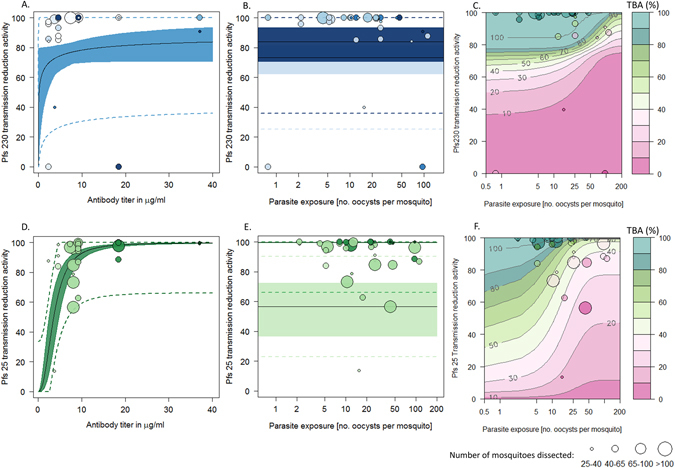
Figure 3.

A comparison of transmission reduction activity (reduction in mean oocyst intensity, TRA) for anti-Pfs230 (panels A, B and C) and anti-Pfs25 (panels D, E and F) antibodies. In all panels point shading denotes exposure in oocysts/mosquito (darkest shades match highest exposures). Point size indicates the mean number of dissected mosquitoes dissected. (A and D) Predicted best fit relationship between TRA and antibody titer with 95% confidence intervals showing the uncertainty around the best fit line. The dashed line shows the 95% confidence intervals for single TRA estimates. B and E: Best fit model showing (with 95% confidence intervals) how TRA does not change with parasite exposure. Point and area shading feature antibody titer (dark colors match for 40 µg/ml IgG titers and light colors, for 4 µg/ml). (C and F) Model predictions of how transmission blocking efficacy (TBA) changes with TRA and parasite exposure. Contours show how the best fit models in Fig. 1 can be used to convert TRA into TBA according to the level of exposure. These model predictions are then compared to the true TBA results (data points).
