
Figure 4.
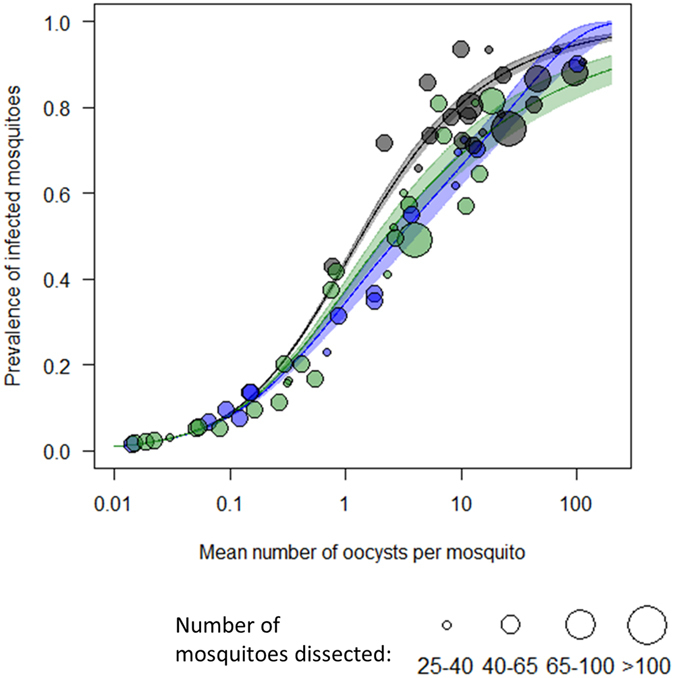
Prevalence of infected mosquitoes depending on the average number of oocysts per mosquitoes for the control group (black), for anti-Pfs230 (blue) and anti-Pfs25 (green). Solid line shows the best fit model for the relationship between prevalence and intensity of oocysts in the mosquito population as predicted by the model (shaded area shows 95% confidence intervals around the best fit line). Size of the data points are relative to the number of mosquitoes dissected.