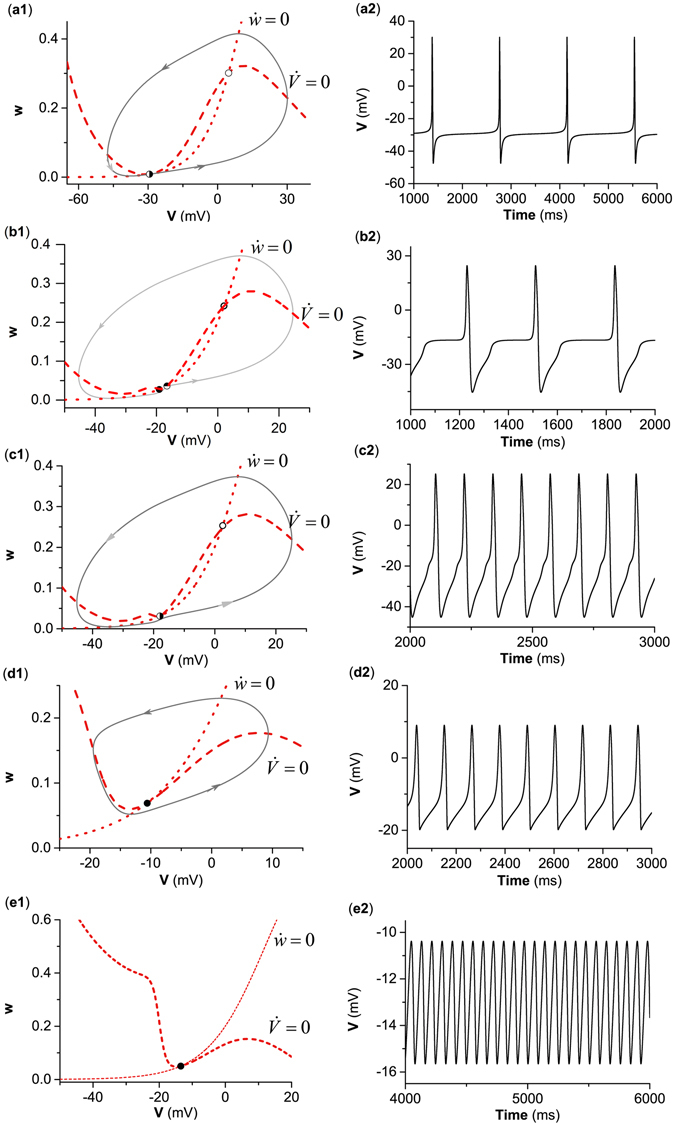
Figure 3.

Dynamics corresponding to or near the different bifurcation points. (a) SNIC with g inh = 0 μS/cm2; (b) BHom with g inh = 0.5 μS/cm2; (c) with g inh = 0.5 μS/cm2; (d) SubH with g inh = 3.5 μS/cm2; (e) SupH at = g inh = 4.4 μS/cm2. Left: nullclines, equilibriums, and limit cycles or orbits in the phase portraits; Right: Spike trains. Parameter values: (a2) I app = 39.98 μA/cm2; (b2) I app = 43.572 μA/cm2; (c2) I app = 44.8461 μA/cm2; (d2) I app = 179.2 μA/cm2; (e2) I app = 217.39 μA/cm2. In panels (a1–e1), the red dotted line and dashed line represent nullcline and nullcline , respectively. The solid line represents trajectory and arrow indicates direction.
