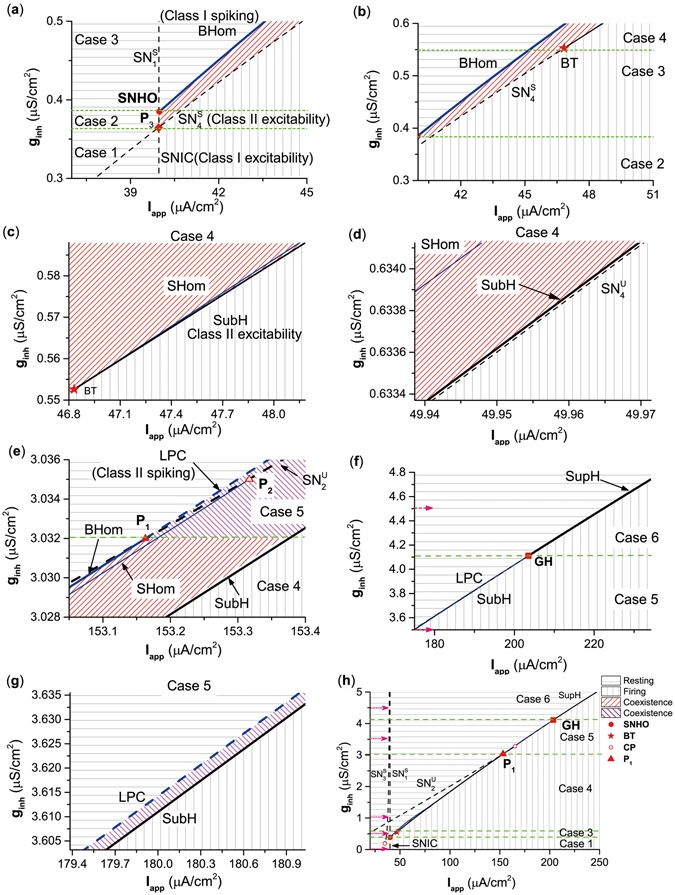
Figure 5.

Two-parameter bifurcations in the plane (I app, g inh) of the ML model with an inhibitory autapse. (a) Partial enlargement of the bifurcation diagram around SNHO and P 3. (b) Partial enlargement of the bifurcation diagram around BT. (c) Partial enlargement of the bifurcation diagram is up and to the right of BT in (b). (d) Further amplification is up and to the right of BT in (b). (e) Partial enlargement of the bifurcation diagram around P 1. (f) Partial enlargement of the bifurcation diagram around GH in (h). (g) Partial enlargement of the bifurcation diagram is up and to the right of GH. (h) Global view of the bifurcation diagram. Figure (a–f) is a part of Fig. (h). SNIC represents the curve of saddle-node bifurcation on an invariant circle. SubH and SupH are subcritical Hopf curve and supercritical Hopf curve, respectively. BHom and SHom are saddle homoclinic orbit bifurcation curves. and (i = 1, 2, 3, 4) are curves of saddle node bifurcation of equilibrium. LPC represents the curve of saddle node bifurcation of limit cycle. CP is cusp bifurcation. BT is Bogdanov-Takens bifurcation. SNHO is saddle-node separatrix-loop. GH is Bautin bifurcation.
