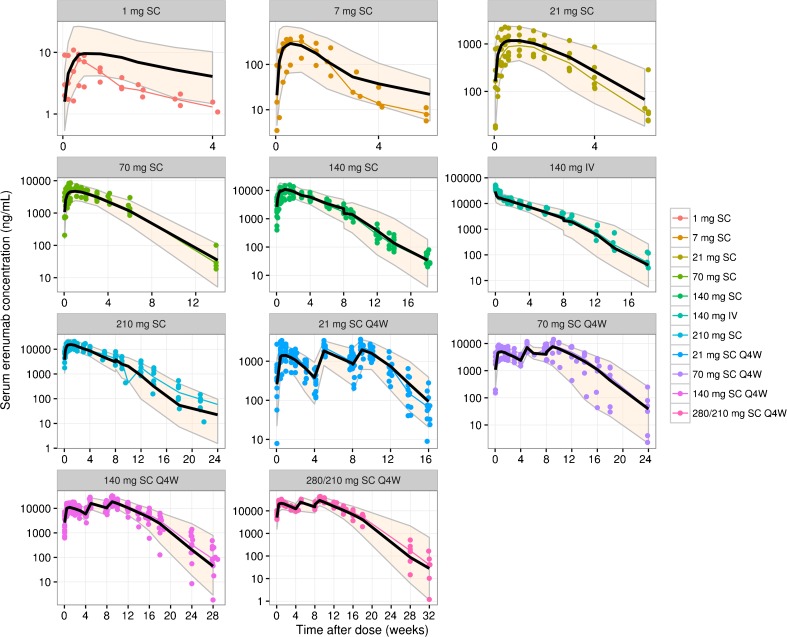
Fig. 2.
Visual predictive checks for the final pharmacokinetic model of erenumab concentrations. Colored symbols and lines are individual observations and the medians of the observations for the corresponding dosing cohorts; solid black lines and shaded bands are the model predicted 50th and 90th percentiles. IV, intravenous; Q4W, every 4 weeks; SC, subcutaneous.

