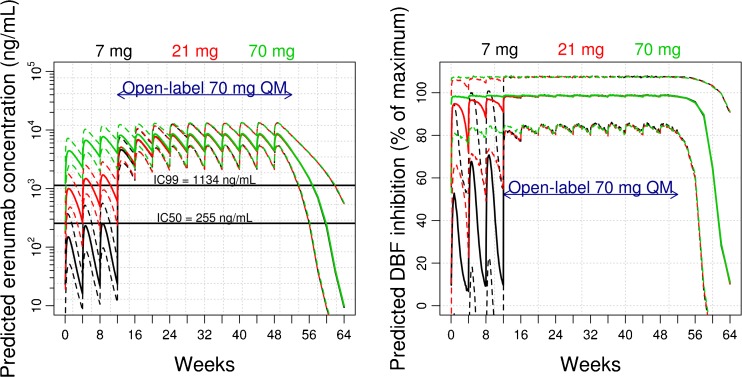
Fig. 5.
Predicted erenumab pharmacokinetics (PK) (left panel) and dermal blood flow (DBF) inhibition (right panel) for the selected doses in the phase 2 trial. Solid lines represent median population predictions; dashed lines represent 90% prediction intervals that account for total variability in PK or DBF response. The predicted DBF inhibition is expressed as percentage of the maximum possible inhibition (percent of Imax [89%]). QM, monthly.

