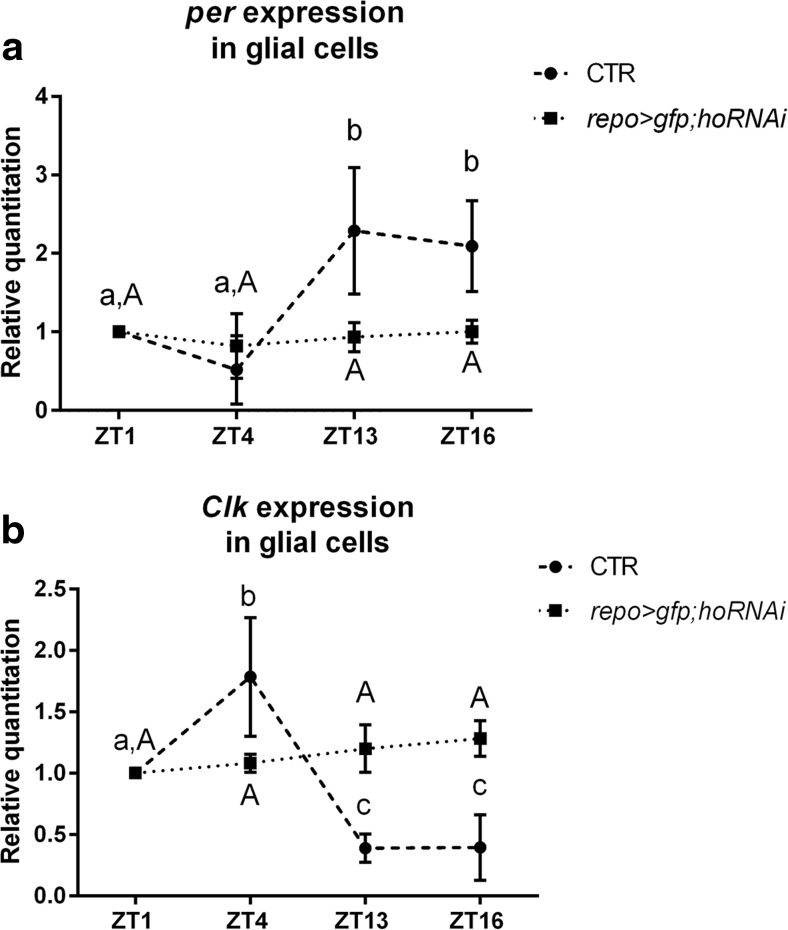
Fig. 3.
Effect of ho silencing in the glial cells on per (a) and Clk (b) expressions in the glial cells of repo>hoRNAi;gfp Drosophila strain. As a control, repo>gfp strain was used (CTR). Statistically significant differences are marked with letters (lowercase letters for control and uppercase letters for hoRNAi); data are normalized to ZT1 as value 1. Non-parametric Kruskal–Wallis test, parametric ANOVA Tukey’s test: p < 0.05. Graph represents average clock gene expression level ± SD

