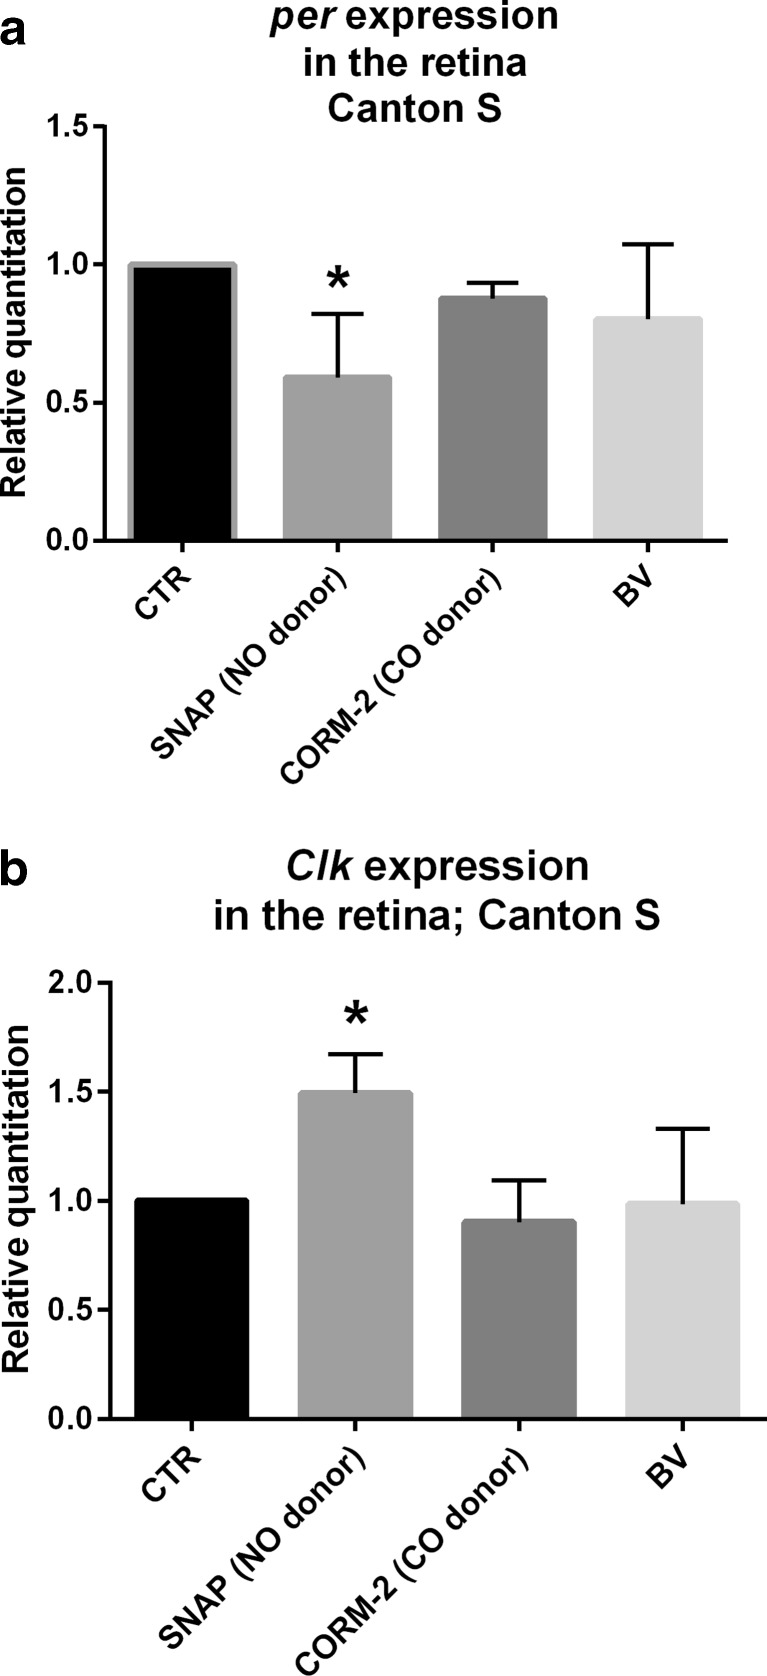
Fig. 4.
Effects of SNAP (500 μM), CORM-2 (500 μM), and biliverdin (BV; 500 μM) treatments compared with control on per (a) and Clk (b) gene expressions in the retina of wild-type D. melanogaster. Data are normalized to the control as value 1. Statistically significant differences are marked with stars, p < 0.05. Mann–Whitney test: p < 0.05. Bars represent average clock gene expression ± SD

