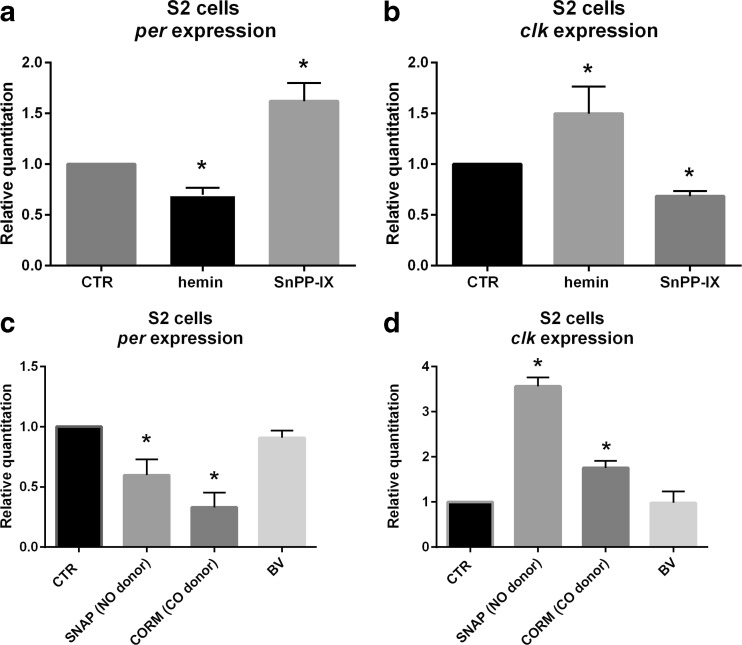
Fig. 6.
Effects of hemin, SnPPIX, CORM-2, biliverdin, and SNAP treatments on per (a, c) and Clk (b, d) gene expressions in S2 cells in vitro culture. RNA was isolated after 6 h of cell culturing with chemicals or control. Data are normalized to the control (CTR) as value 1. Mann–Whitney test: p < 0.05. Bars represent average clock gene expression level ± SD

