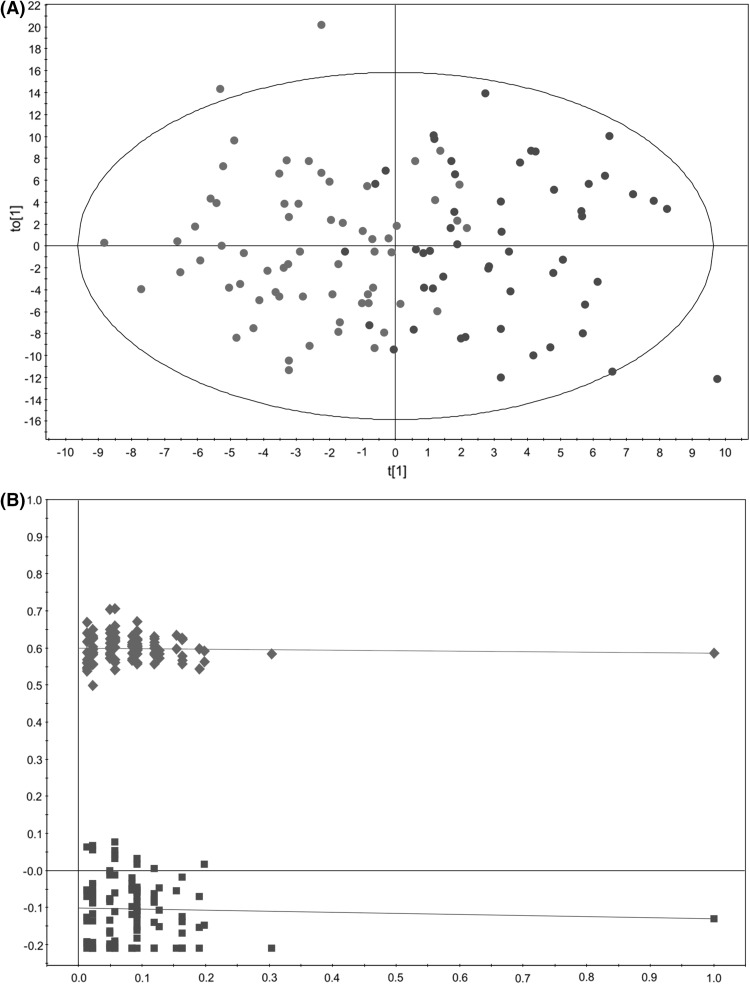
Fig. 3.
Multivariate modelling resulting from the analysis of urine 1H-NMR spectra before variable selection (823 variables). a OPLS-DA score plot for the comparison between PCa patients (red circle) vs. individuals diagnosed with BPH (blue circle); b internal validation of the corresponding OPLS-DA model by permutation analysis (n = 100), R2 (green diamond), Q2 (blue square)

