
Figure 5.
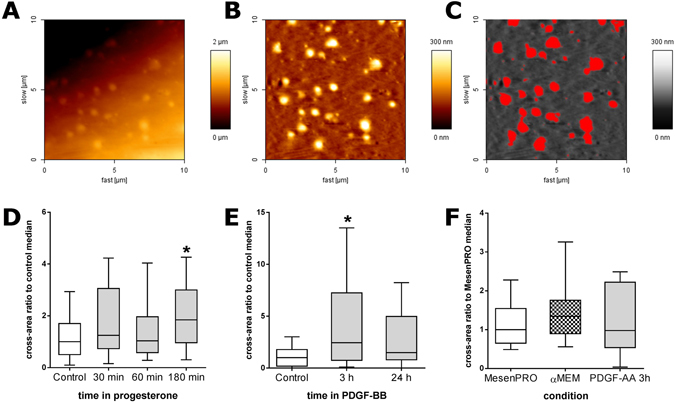
Effect of different treatments or conditions on the amount of membrane protrusions. (A) AFM raw topographic image of a 10 × 10 µm area on the surface of an ADSC (this example corresponds to a cell under progesterone treatment for 30 min). (B) The same area after flattening, as described in the methods section. (C) Cross-sectional areas of protruding elements at 50 nm height above the mean cell surface, in red; these areas were used for quantifying the amount of protrusions in different culture conditions, as shown in (D–F). (D) Early effects of the addition of 0.5 mM progesterone (n = 30). (E) Effect of the addition of 10 ng/ml PDGF-BB at 3 h or 24 h (n = 20). (F) Effect of culturing on basal medium without serum (αMEM) or of treating the cells with PDGF-AA (n = 10). Tukey’s box and whiskers plots, where the central line represents median values, boxes represent the interquartile range (IQR) and whiskers extend to the extreme values within 1.5 times the IQR. Values have been normalized by dividing by the median of their respective controls (cells maintained in MesenPRO medium in each experiment). In D and E, Kruskal-Wallis one-way analysis of variance showed statistically significant differences (P < 0.05). Asterisks (*) mark the treatments where differences with respect to controls were detected (post-hoc Dunn’s test, P < 0.05).