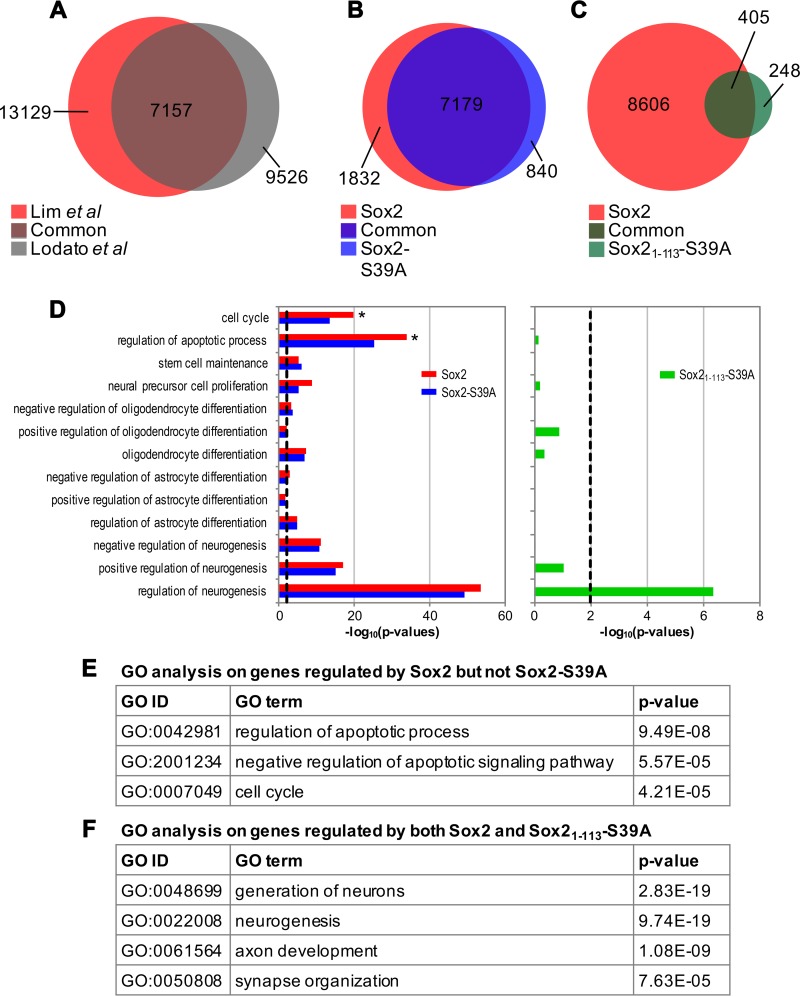
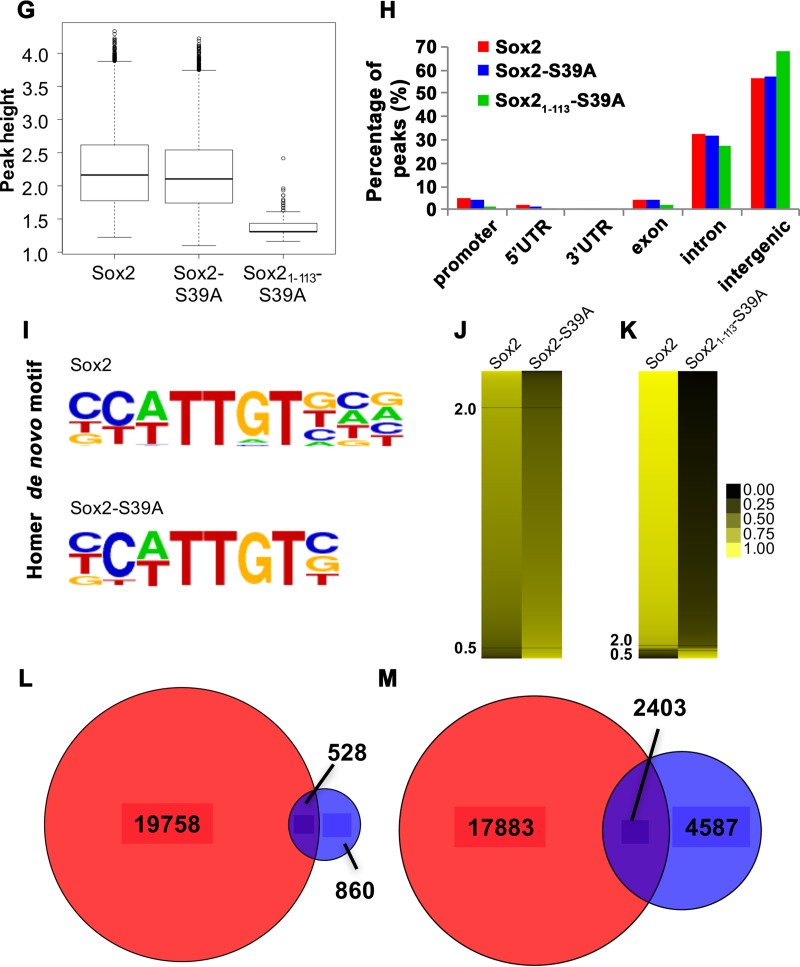
FIG 6.
Nonphosphorylated Sox21–113 binds specifically to neurogenic genes. (A) Venn diagram displaying the extent of overlap between full-length Sox2 ChIPseq peaks obtained from the current study (red) and that from a published source (gray) (61). (B and C) Venn diagrams indicating the number of overlapping genes bound by full-length Sox2 (red) and Sox2-S39A (blue, B) or the fragment Sox21–113-S39A (green, C). (D) Gene ontology (GO) analysis of the target genes of Sox2 (red), Sox2-S39A (blue), and Sox21–113-S39A (green). The black dashed line indicates a P value of 0.01. (E) Gene lists were intersected and GO analysis was performed on genes that are regulated by Sox2 but not Sox2-S39A. Top hits are shown together with the GO identifier (ID) and P value. (F) Gene lists were intersected and GO analysis was performed on genes that are regulated by both Sox2 and Sox21–113-S39A. Top hits are shown together with the GO ID and P value. (G) Peak height distribution of the indicated libraries. Boxes represent the 25th to 75th percentile of peaks, with the median shown as an intersection. The y axis displays log 2-transformed peak scores. (H) Genome distribution of peaks obtained from the Sox2 (red), Sox2-S39A (blue), and Sox21–113-S39A (green) ChIPseq libraries. Peaks were assigned based on their proximity to promoters, 5′ untranslated region (UTR), 3′UTR, exons, introns, or intergenic regions. (I) Position weight matrices (PWMs) of motifs identified de novo in peaks bound by Sox2 or Sox2-S39A. The canonical Sox2 motif is the most enriched in both data sets. (J) Heat map to indicate reads from each peak of the indicated data sets (full-length Sox2 and Sox2-S39A) after it has been normalized to the average of merged reads from corresponding peaks of both data sets. Values would therefore range from 0 (black) to 1 (yellow), where values close to 1 represent peaks unique that given data set and a value of 0.5 indicating perfect concordance among the two data sets. Black horizontal lines indicate fold changes of more than 2 (upper) and 0.5 (lower). (K) Heat map as in panel J but comparing between Sox2 and Sox21–113-S39A. (L and M) Venn diagrams of the comparisons of our wild-type Sox2 ChIPseq peaks (red) with those described in references 79 (blue, L) and 80 (blue, M).


