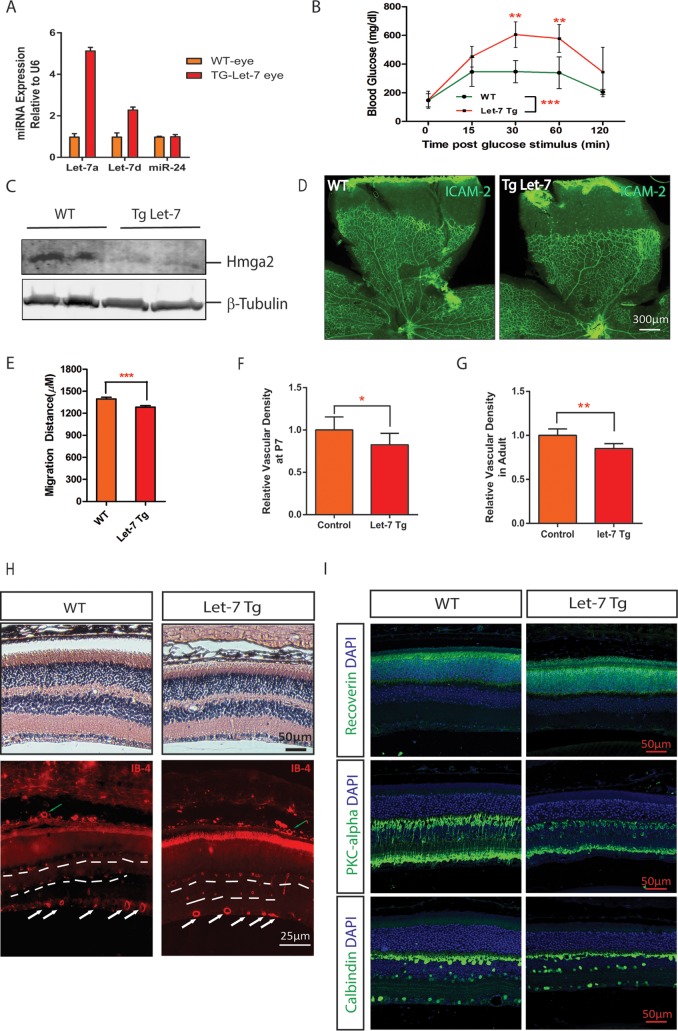
FIG 4.
Delayed retinal vascular development in let-7 transgenic mice. (A) qPCR results showing let-7a and let-7d expression in the retinas of WT and let-7-Tg mice. miR-24 served as a control. (B) let-7-Tg mice show impaired glucose tolerance in let-7-Tg mice. The blood glucose level at 0 to 120 min after glucose stimulation was measured. Statistics were derived from three wild-type and three let-7 transgenic mice. **, P < 0.01; ***, P < 0.001. (C) Downregulation of let-7 target protein Hmga2 in the retinas of let-7-Tg mice, as shown by Western blotting. β-Tubulin was used as a loading control. Band density analyses were performed from three WT and three let-7 transgenic mice (band density = 0.9 ± 0.1 in WT versus 0.45 ± 0.05 in let-7-Tg; **, P < 0.01). (D) Flat-mount ICAM-2 staining of retinal vasculature in WT and let-7-Tg mice. (E) Quantification of retinal vessel sprouting distance in panel C. ***, P < 0.001. (F) Quantification of the retinal vessel densities shown in panel C. *, P < 0.05. (G) Quantification of the retinal vessel densities in adult WT and let-7-Tg mice. **, P < 0.01. (H) H&E staining and isolectin-B4 staining of retinal sections in WT and let-7-Tg mice. White arrows indicate the superficial retinal vessels, green arrows indicate the choroidal vessels, and dashed lines ondicate the intermediate and deep layers of retinal vessels. Note that the rupture in WT retinas in the H&E staining images is a histological artifact. (I) Antibody staining of retinal sections in WT and let-7-Tg mice. The antibodies used included recoverin (a marker of photoreceptor cells), PKC-alpha (a marker of bipolar cells), and calbindin (a marker of ganglion cells). DAPI (4′,6′-diamidino-2-phenylindole) was used to stain the nuclei. Scale bar, 50 μm.

