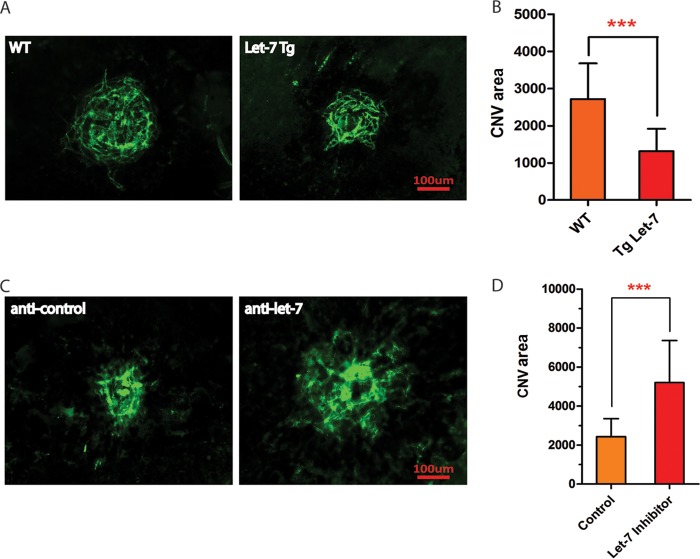
FIG 7.
let-7 regulates pathological angiogenesis in mice. (A) Representative confocal images of ICAM-2 staining showing repression of laser-induced CNV in let-7-Tg mice compared to the controls. Scale bar, 100 μm. (D) Quantification of CNV area (μm2). The P value was calculated from the CNV area from 24 WT and 18 let-7 transgenic mice. ***, P < 0.001. (C) Representative confocal images of ICAM-2 staining showing an increase in laser-induced CNV by LNA–anti-let-7 compared to a scramble control. Scale bar, 100 μm. (B) Quantification of CNV area (μm2). The P value is calculated from the CNV area from 12 control anti-miR-injected and 11 LNA–anti-let-7-injected mice. ***, P < 0.001.

