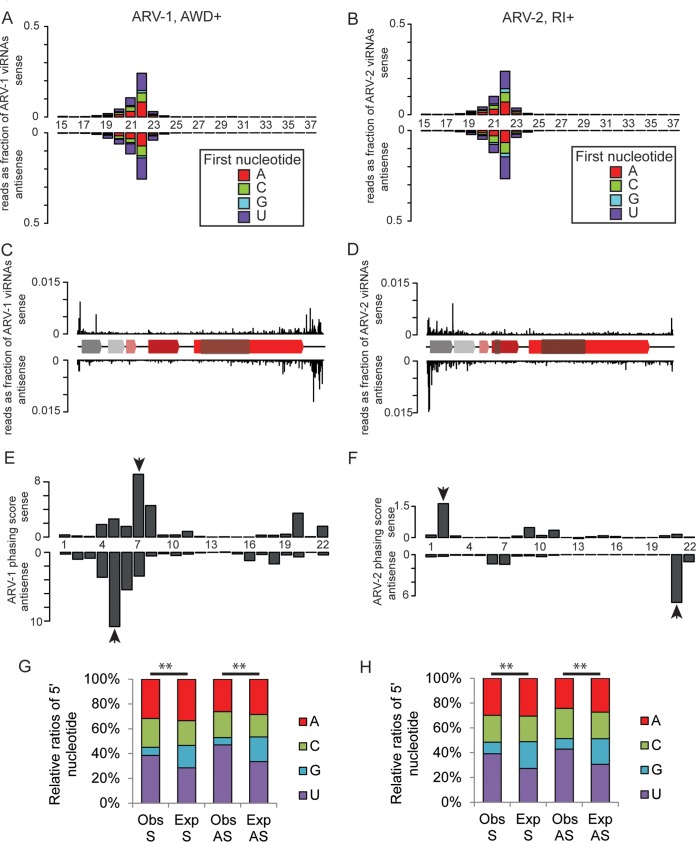
FIG 5.
Small RNA analysis of ARV-1 and ARV-2 in honey bees. (A and B) Size distributions (15 to 37 nt) and 5′-nucleotide compositions of small RNAs arising from ARV-1 (A) and ARV-2 (B). The sample from which the small RNA library was produced is shown above each graph. Bars plotted above the x axis represent reads that map to the positive strand, and those plotted below represent those that map to the negative strand. Bars are colored according to the proportions of reads starting with A, C, G, and T. (C and D) Mapping of 20- to 23-nt-long viral RNAs (viRNAs) to the genomes of ARV-1 (C) and ARV-2 (D). The cartoon shows the domains of the viral genomes as shown in Fig. 2. (E and F) Phasing score over 8 phasing cycles for each position within a 22-nt phasing window. The top and bottom graphs show the phasing scores for the sense and antisense reads, respectively. A high score indicates that many small RNAs fall into that phase position (indicated with arrowheads). This analysis was performed by using the 21- to 23-nt-long reads from panels A and B. (G and H) Observed 5′ nucleotide (Obs) compared with that expected (Exp) from the base compositions of the viral genomes for ARV-1 (G) and ARV-2 (H). Sense (S) and antisense (AS) reads were compared by using a chi-squared test. **, P value of <0.01.

