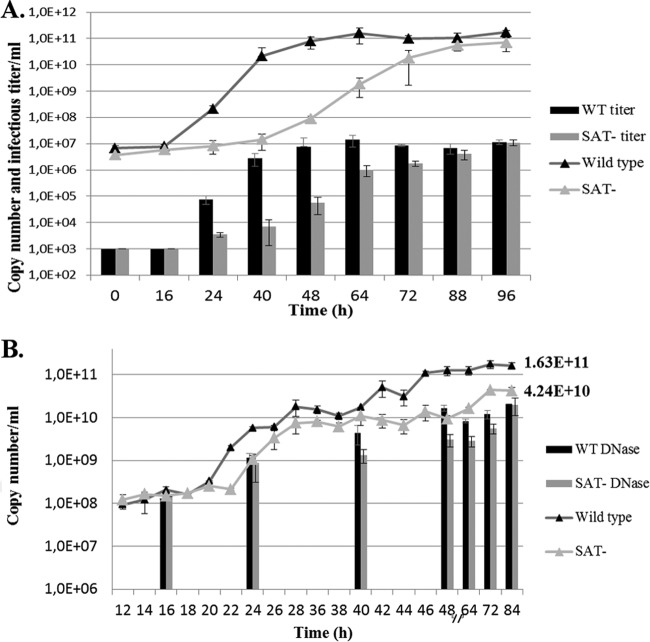
FIG 3.
Change of the viral copy numbers during infection in the medium of PT cells. (A) Copy numbers and infectious titers (triangles and columns, respectively) at a low multiplicity of infection (MOI, 0.01). (B) Total copy numbers and copy numbers measured after DNase treatment (triangles and columns, respectively) at a high multiplicity of infection (MOI, 3). Error bars indicate standard deviations.

