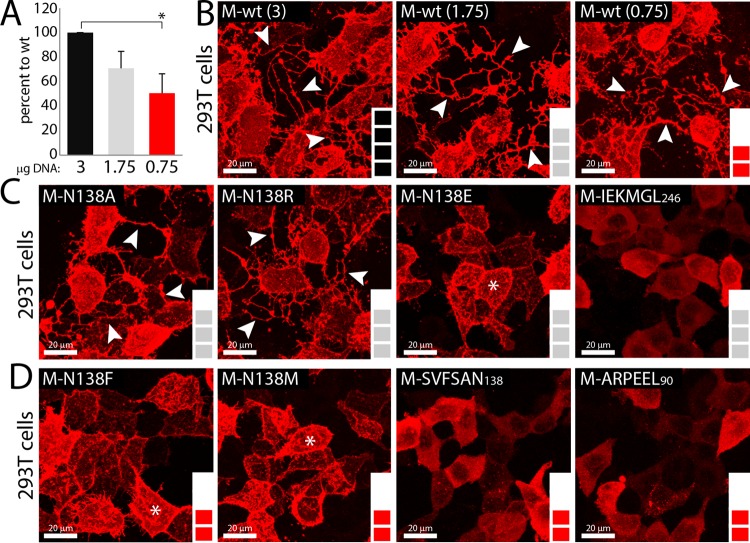
FIG 6.
Differential triggering of membrane deformation by various M proteins. (A) Amounts of transfected M-wt DNA needed to match group 1 (∼70 to 85%) and 2 (∼50%) expression levels (color coding is as described in the legend to Fig. 2B and C). Expression was assessed by immunoblotting and semiquantitative evaluation, performed as described in the legend to Fig. 2B. *, P < 0.05 by one-way ANOVA with Holm-Bonferroni correction and by t tests. (B to D) Immunofluorescence analyses performed as described in the legend to Fig. 1C, without nuclear counterstaining. To gain an overall 3D view of cells, 50 z-stack images were acquired and digitally merged. (B) M-wt exhibiting 100, 70, and 50% expression levels, depending on the amount of plasmid DNA transfected. (C) M mutants exhibiting ∼70 to 85% expression levels. (D) M mutants exhibiting ∼50% expression levels. Images were captured with a scanning confocal laser fluorescence microscope (Olympus). White arrows indicate long cell protrusions, and white stars indicate short filopodium-like membrane structures.

