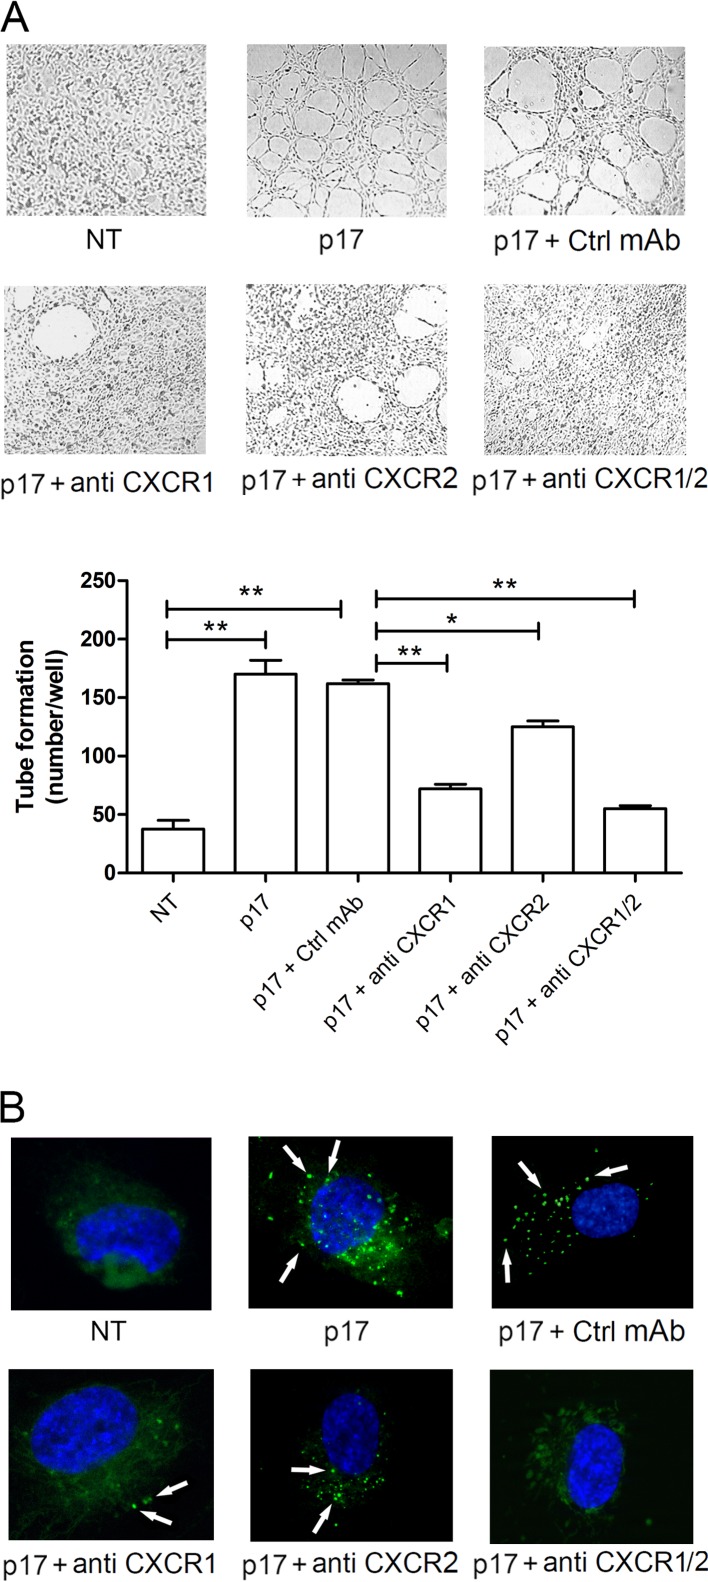
FIG 3.
CXCR1 and CXCR2 drive the autophagy-based activity of p17. (A) LN-LECs were starved for 16 h and then stimulated or not with p17 (10 ng/ml) in complete medium. Starved cells were pretreated for 1 h at 37°C with 2.5 μg/ml of an isotype-matched MAb (Ctrl MAb), a neutralizing MAb to CXCR1 (anti-CXCR1), and/or a neutralizing MAb to CXCR2 (anti-CXCR2), as indicated, before p17 stimulation. Pictures were taken after 12 h of culture on growth factor-reduced Cultrex BME (magnification, ×10) and are representative of three independent experiments with similar results. Values reported for tube formation are the means ± SDs of three independent experiments with similar results. Statistical analysis was performed by one-way ANOVA; a Bonferroni posttest was used to compare data (*, P < 0.05; **, P < 0.01). (B) LN-LECs were nucleofected with EGFP-LC3 plasmid and, 24 h after nucleofection, incubated in serum-deprived medium for 16 h. Cells were then stimulated with p17 (10 ng/ml) for 3 h in complete medium. Starved cells were pretreated for 1 h at 37°C with 2.5 μg/ml of an isotype-matched MAb (Ctrl MAb), a neutralizing MAb to CXCR1 (anti-CXCR1), and/or a neutralizing MAb to CXCR2 (anti-CXCR2), as indicated, before p17 stimulation. The images display LC3 signals in green and cell nuclei in blue. Magnification, ×100. White arrows indicate dot-like LC3+ structure formation. NT, not treated.

