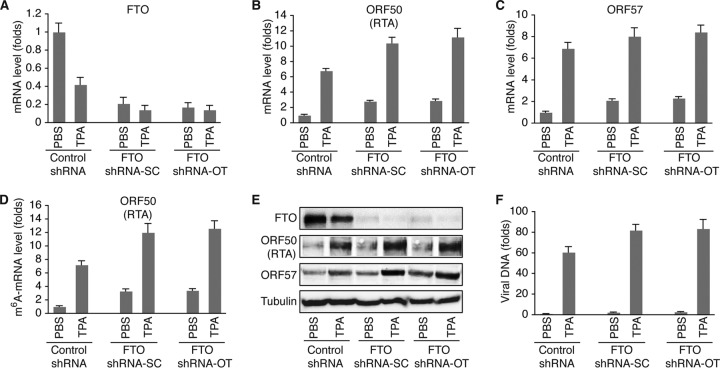
FIG 5.
shRNA KD of FTO increases m6A and KSHV lytic gene expression. (A) Levels of FTO mRNA in BCBL1 cells expressing FTO-specific shRNA from Santa Cruz Biotechnologies (shRNA-SC) or Origene Technologies, Inc. (shRNA-OT), or control shRNA. The cells were treated with PBS or TPA for 24 h. (B and C) Levels of ORF50 (RTA) (B) and ORF57 (C) mRNAs in the cells described in the legend to panel A. (D) Levels of m6A-mRNA of ORF50 (RTA) in the cells described in the legend to panel A. (E) Western blot detection of FTO and KSHV lytic proteins encoded by ORF50 (RTA) and ORF57 in the cells described in the legend to panel A. The level of the housekeeping gene β-tubulin was used as a loading control. (F) Relative levels of KSHV virions in the supernatants of the cells described in the legend to panel A at 96 h after TPA stimulation, determined by quantitative PCR using primers specific for ORF72. The cellular debris in the supernatants was removed by high-speed centrifugation (4,000 × g, 15 min), followed by filtration through 0.8-μm-pore-size filters. Total DNAs from 200 μl of each supernatant and 200 μl of the corresponding cells were purified by using a Qiagen genomic DNA purification kit. The level of viral DNA in each supernatant was normalized to that of the corresponding cellular DNA measured with primers specific for β-actin. The level of viral DNA in the supernatant from cells expressing control shRNA and treated with PBS was set as a reference and was equal to 1, and the relative level (fold change) of viral DNA in any of the other supernatants was calculated by using the formula 1/2ΔCT, where ΔCT is the difference in the CT values after normalization between the supernatant in question and that of the reference. All quantitative PCRs were carried out in triplicate.

