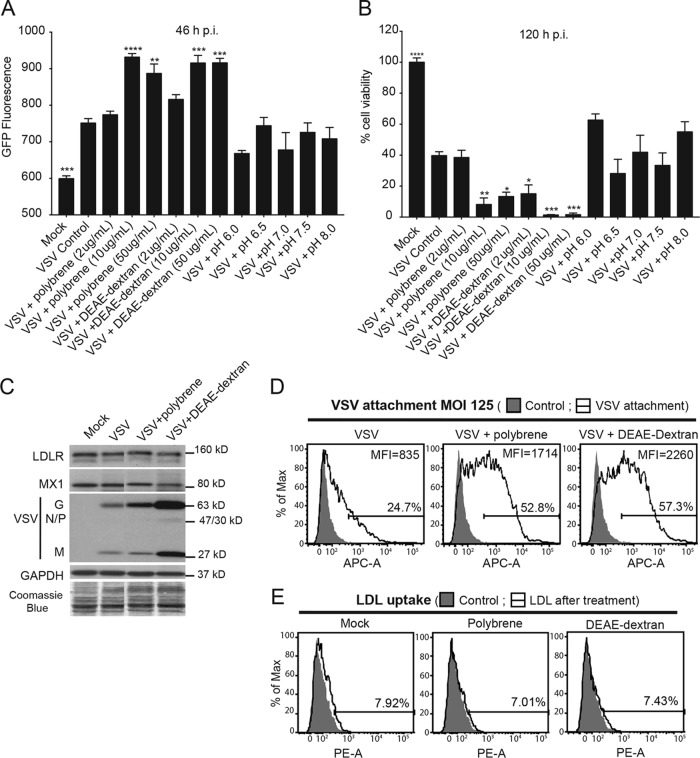
FIG 6.
Effects of polycation treatment on VSV attachment, replication, and oncolysis. (A and B) Cells were treated with MEM (without FBS) containing Polybrene, DEAE-dextran, or a different pH for 30 min, and then VSV-ΔM51-GFP at an MOI of 0.1 (based on titration on HPAF-II cells) was added for 1 h at 37°C (under the same conditions). Cells were then washed and incubated at 37°C. (A) GFP fluorescence was analyzed at 46 h p.i. The assay was done in triplicate, and data represent the means ± standard errors of the means. Conditions were compared by using 1-way analysis of variance followed by the Dunnett posttest for comparison to “+VSV Control.” *, P < 0.05; **, P < 0.01; ***, P < 0.001; ****, P < 0.0001. (B) At 5 days p.i., cells were analyzed for viability by an MTT assay. The assay was done in triplicate, and data represent the means ± standard errors of the means. Conditions were compared by using 1-way analysis of variance followed by the Dunnett posttest for comparison to “VSV Control” representing cells treated with VSV only. *, P < 0.05; **, P < 0.01; ***, P < 0.001; ****, P < 0.0001. (C) Cells were pretreated with Polybrene (10 μg/ml) and DEAE-dextran (10 μg/ml) and then incubated with VSV-ΔM51-eqFP650 for 1 h at 4°C. The MOI was 250 based on titration on MIA PaCa-2 cells. Protein isolates were used for Western blot analyses. Protein product sizes (kilodaltons) are indicated on the right. GAPDH and Coomassie blue stain were used to indicate equal loading. Samples were run on the same gel, and irrelevant lanes were removed. (D) Cells in suspension were treated as described above. The MOI was 125 based on titration on MIA PaCa-2 cells. After incubation with VSV-G primary antibody and APC-conjugated secondary antibody, cells were analyzed by FACS analysis using the APC-A channel. Control indicates cells that were mock treated (without VSV), and primary and secondary antibodies were used. “VSV attachment” cells were incubated with various amounts of VSV (the indicated MOIs are based on virus titration on MIA PaCa-2 cells). Gated populations are positive for VSV attachment (the percentage of VSV-positive cells is indicated above the gate line). The MFI for each population was calculated by using FlowJo software (TreeStar). (E) Cells were pretreated at the same concentrations as the ones described above and then incubated with fluorescently labeled LDL for 4 h at 37°C. Samples were analyzed by FACS analysis using the PE-A channel. “Control,” fluorescently labeled LDL was not added; “LDL,” fluorescently labeled LDL was added. Treatments are indicated at the top of each histogram. The mock samples are the same as the ones in Fig. 3B. Gated populations are positive for LDL uptake (the percentage of LDL-positive cells is indicated above the gate line). The MFI for each population was calculated by using FlowJo software (TreeStar).

