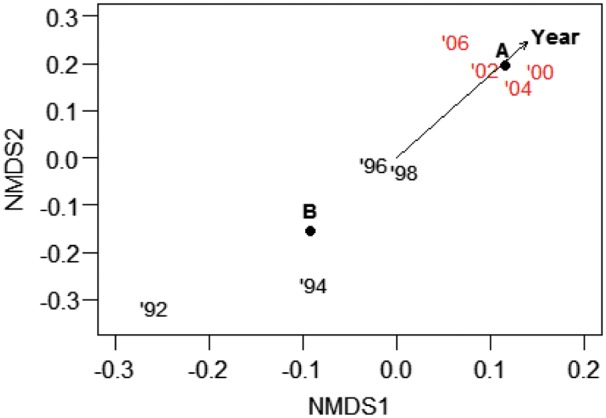
Figure 3.

Non-metric multidimensional scaling (NMDS) of the understory vegetation layer in spring 1992–2006 at Fermilab, IL (N = 65-130 one-m2 quadrats). Red year numbers indicate monitoring conducted after deer reduction from 24.6 to 2.5 deer/km2 in 1998/9. Year, a continuous factor, is represented by a vector (arrow) and deer reduction, a categorical factor indicating before (B) or after (A) the deer cull, by its compositional centroid. Points are jittered to allow visualization.
