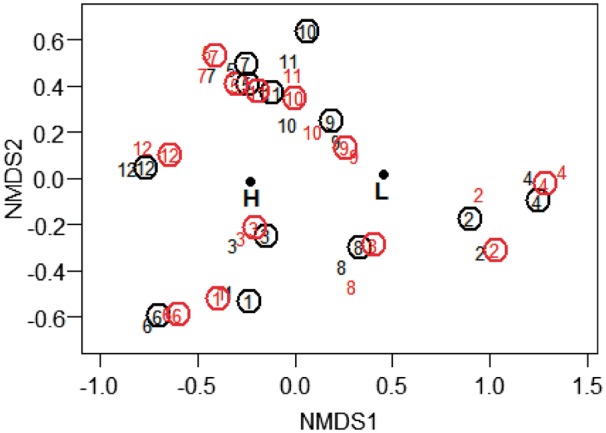
Figure 7.

NMDS of the understory vegetation layer in May and July 2009 and 2012 in open and fenced plots at 12 sites at West Point NY (N = 10 permanent monitoring quadrats per plot). Numbers indicate study sites. Black and red numbers indicate sampling year (2009 and 2012, respectively) and circled numbers represent fenced plots. Earthworm density, a categorical factor indicating low (L) or high (H) earthworm density is represented by its compositional centroid. Points are jittered to allow visualization.
