
Fig. 3.
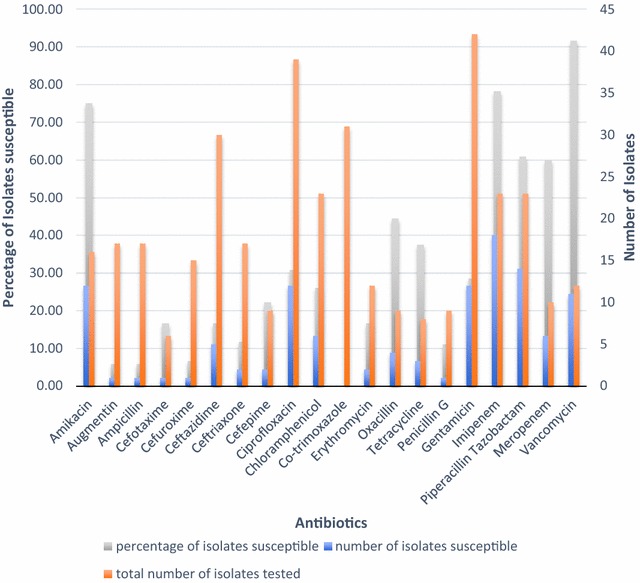
Overall susceptibility patterns of organisms isolated at 48–72 h. The graph shows the proportion of isolates susceptible to each antibiotic and the number of isolates tested against each antibiotic
Official websites use .gov
A
.gov website belongs to an official
government organization in the United States.
Secure .gov websites use HTTPS
A lock (
) or https:// means you've safely
connected to the .gov website. Share sensitive
information only on official, secure websites.
Overall susceptibility patterns of organisms isolated at 48–72 h. The graph shows the proportion of isolates susceptible to each antibiotic and the number of isolates tested against each antibiotic