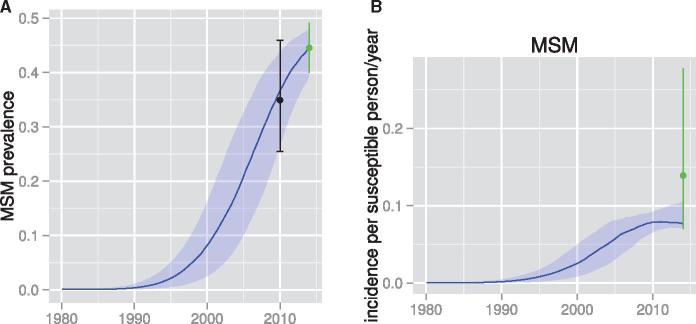
Figure 2.
Estimated prevalence and incidence patterns through time based on phylodynamic analysis. Lines show median posterior estimates and shaded regions show 95% credible intervals. (A) Prevalence in MSM. The black error bar shows estimates from the Nigerian National IBBSS conducted in 2010 which were also used as priors in the phylodynamic analysis. The green error bar shows estimates based on the TRUST study conducted in 2014 which were also used as priors in the phylodynamic analysis. (B) Estimated incidence rate in MSM. The green error bar was estimated in 2014 from the TRUST study and was also used to define priors in the phylodynamic analysis.

