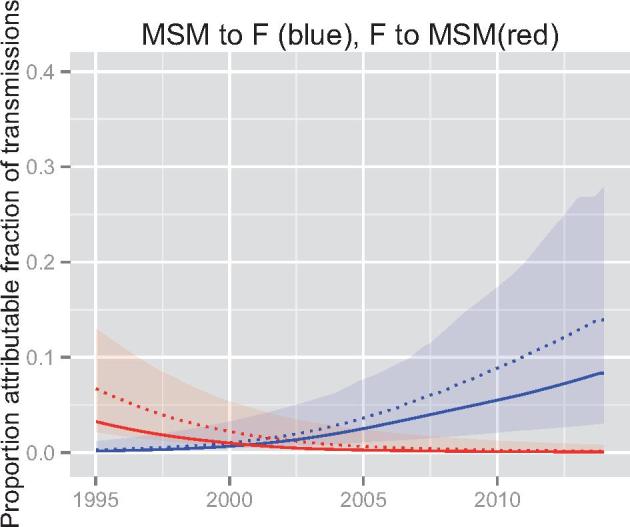
Figure 3.

Proportion attributable fraction of transmissions based on phylodynamic analysis. Lines show median posterior estimates and shaded regions show the 95% credible interval. Blue denotes the proportion of infections among women in the general population due to the role of MSM. Solid line represents the maximum posterior estimate, and dashed represents the median posterior estimate. Red denotes the proportion of infections among MSM attributable to the role of the general population.
