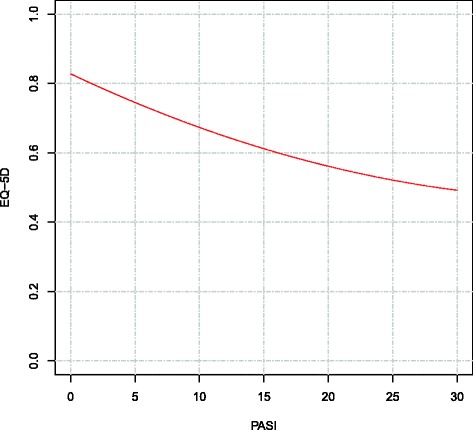
Fig. 2.

Predicted EQ-5D-3L values given marginal changes in PASI. Using the results of the fixed-effects regression model, PASI was varied from 0 to 30, showing the predicted marginal impact on EQ-5D-3L. Although PASI can theoretically range from 0 to 72, a cut-off of 30 was chosen based on the 99th percentile of observed PASI scores, equal to 25.1. All other variables in the model were held constant at their respective averages. The curve shows the non-linear relationship between PASI and EQ-5D-3L, where increases in PASI close to 0 have a larger impact on EQ-5D-3L than an equally-sized increase in PASI at higher ends of the PASI scale
