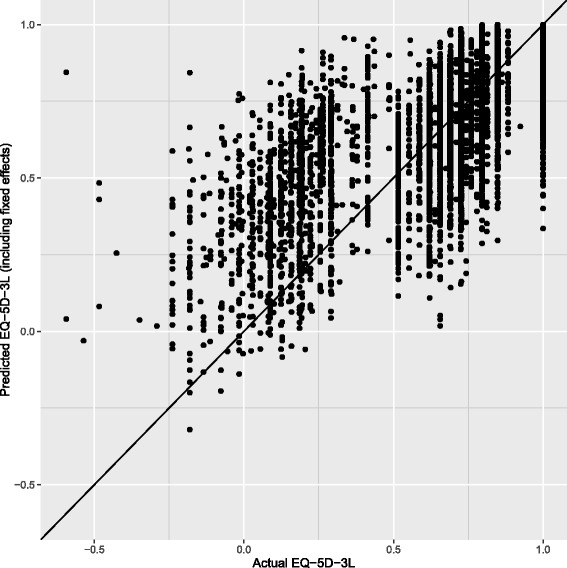
Fig. 3.

Actual vs. predicted values of EQ-5D-3L. This model diagnostic figure shows the relationship between the actual observed EQ-5D-3L values compared to the values predicted by the fixed-effects regression model. The 45-degree line indicates where the predicted and actual EQ-5D-3L values are equal. The figure shows that for low actual EQ-5D-3L values, the regression model may overestimate EQ-5D-3L, and for high actual EQ-5D-3L values, the model may under-estimate EQ-5D-3L. Overall, the model predicts EQ-5D-3L with a relatively high level of accuracy
