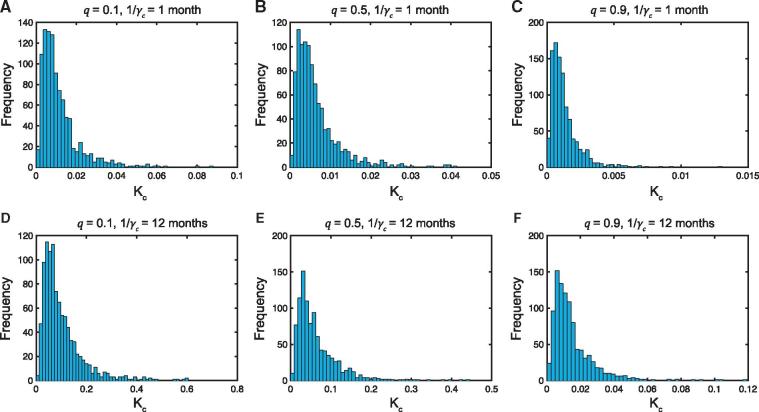
Figure 2.
Sensitivity analysis of model parameters. Frequency distributions of the relative nucleotide substitution rate at the population level in the immunocompromised population compared to the general population from sampling 1000 points of the parameter space using Latin Hypercube Sampling. Panels (a–c) 1 month; Panels (d–f) months. Panels (a,d) ; Panels (b,e) ; Panels (c,f) . In all cases, days, , , and .

