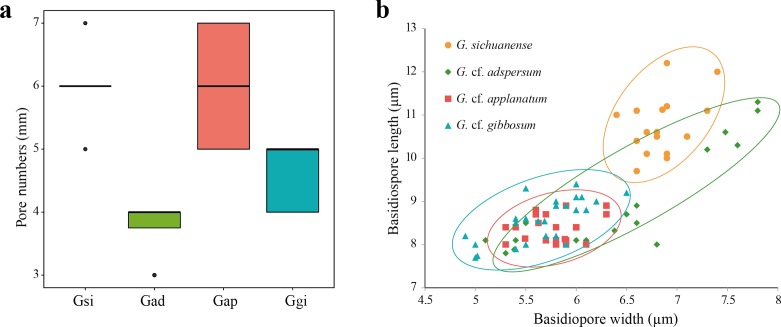
Figure 2. (A) Box plot representing pore number per mm of four Ganoderma species: G. sichuanense (Gsi), G. cf. adspersum (Gad), G. cf. applanatum (Gap), and G. cf. gibbosum (Ggi). Boxes represent the interquartile range between first quartile and third quartile. Bold line in the box is the median and filled circles represent individual outlying data points. (B) Scatter plot of basidiospore size among the four species (mm).
Four samples were observed for each species.

