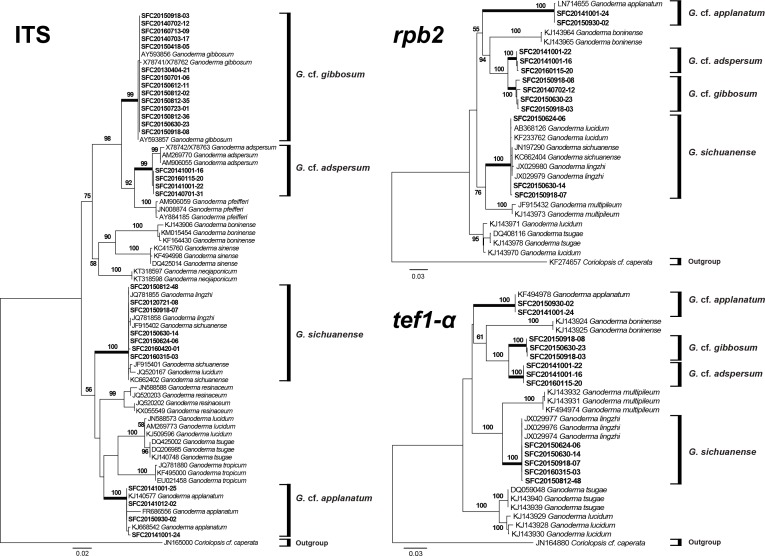
Figure 3. Phylogenetic tree for Ganoderma and related species based on a maximum likelihood (ML) analysis of the internal transcribed spacer (ITS), the second largest subunit of RNA polymerase II (rpb2), and translation elongation factor 1-α (tef1-α).
ML trees were constructed with RAxML 8.0.2 using the GTRGAMMA model of evolution and 1,000 bootstrap replicates. Bootstrap scores of >50 are presented at the nodes. Branches that involved SFC sequences are in bold. The scale bar indicates the number of nucleotide substitutions per site.

