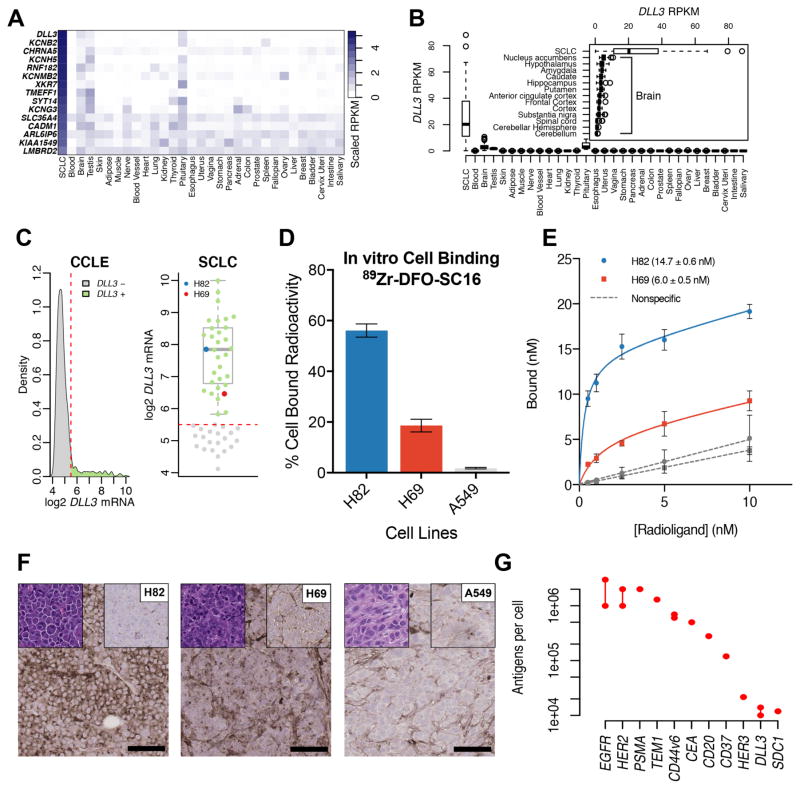
Figure 1. DLL3 is a unique low-abundance cell surface target expressed in small cell lung cancer.
(A) A heat map comparing the median RPKM of cell surface proteins elevated in small cell lung cancer (SCLC) to the median RPKM in normal adult tissues. DLL3 has abundant expression in SCLC and minimal expression in normal tissues with the exception of the pituitary gland, brain and testis; (B) A box plot comparing the median RPKM of DLL3 in SCLC versus normal adult tissues. The inset compares the median expression of DLL3 in SCLC with different tissues of the adult brain, showing maximum expression in the nucleus accumbens; (C) A density plot representing the gene expression data mined for DLL3 expression in cell lines from the Cancer Cell Line Encyclopedia (CCLE). The kernel density on the y-axis represents the cell lines that express DLL3 in levels corresponding to values shown on the x-axis (left); A representation of the density plot after selection for SCLC cells alone (right). Two cell lines – H82 (representing the median of DLL3 expression) and H69 (low DLL3 expression < 25th percentile) were selected for the development of in vitro and in vivo experimental models described in this study; (D) A graph representing the differential in vitro binding of 89Zr-DFO-SC16-NS to H82, H69 and A549 cells, showing cell bound radioactivity (y-axis) in concordance with the level of DLL3 expression in the cell lines; (E) A plot of the saturation binding curves derived from the ex vivo binding of 89Zr-DFO-SC16-NS to sections of H82 and H69 tumor tissue harvested from subcutaneous xenografts in mice. The curves yielded Bmax (maximum number of DLL3 target binding sites for SC16 antibody) on the tumors; (F) Immunohistochemistry on subcutaneous tumor xenografts. H82 showed high DLL3 expression ~ 95% of tumor, H69 showed low DLL3 expression ~ 45% of tumor and A549 showed no DLL3 expression. Left top corner inset: H&E, Right top corner inset: isotype control, Right low corner: scale bar for 100μm (G) A dot plot comparing the average level of expression (protein per cell) of DLL3 with other tumor-associated molecular targets/antigens that have been used for the immunoPET imaging of various cancers.

