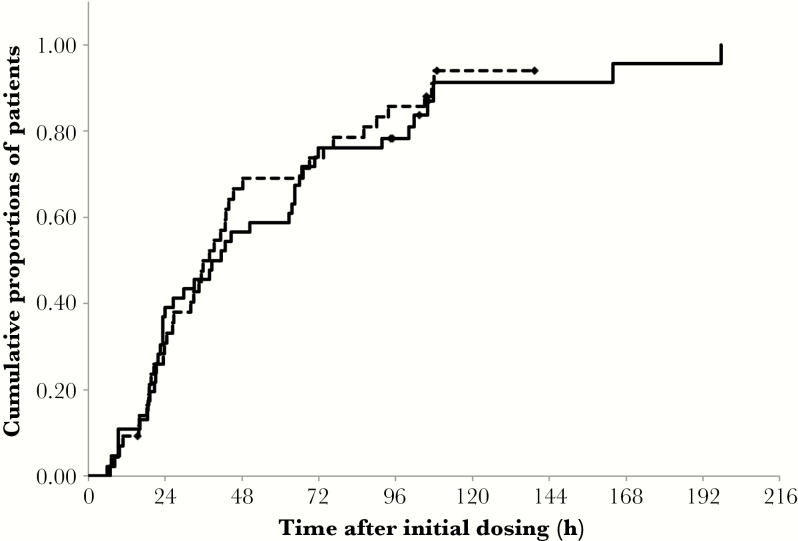
Figure 1.
Kaplan-Meier survival curve for the time to fever alleviation. Solid line: peramivir group (n = 46). Dotted line: oseltamivir group (n = 43). ◆ indicates censored case (n = 4 in peramivir group; n = 4 in oseltamivir group). P value for the difference between treatments was .69 (log-rank test).

