
Figure 4.
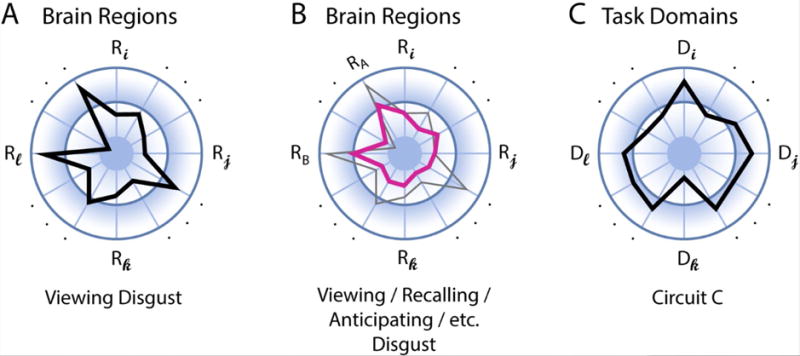
Distributed characterization of structure-function mapping. (A) The polar plot shows the distributed pattern of activation across regions R during an emotion task, such as viewing pictures eliciting disgust. The length of the segments indicates signal strength. (B) Multi-region pattern of activation across tasks. The profile in pink represents the activations that are (relatively) common across tasks (the gray outline is the same profile indicated in panel A). (C) Functional diversity profile of neural circuit of interest. The task domains D represent a set of potential mental functions of interest (spanning perception, cognition, emotion, motivation, and action). For example, this circuit is involved strongly in mental function Di but less so in function Dk.