
Figure 2:
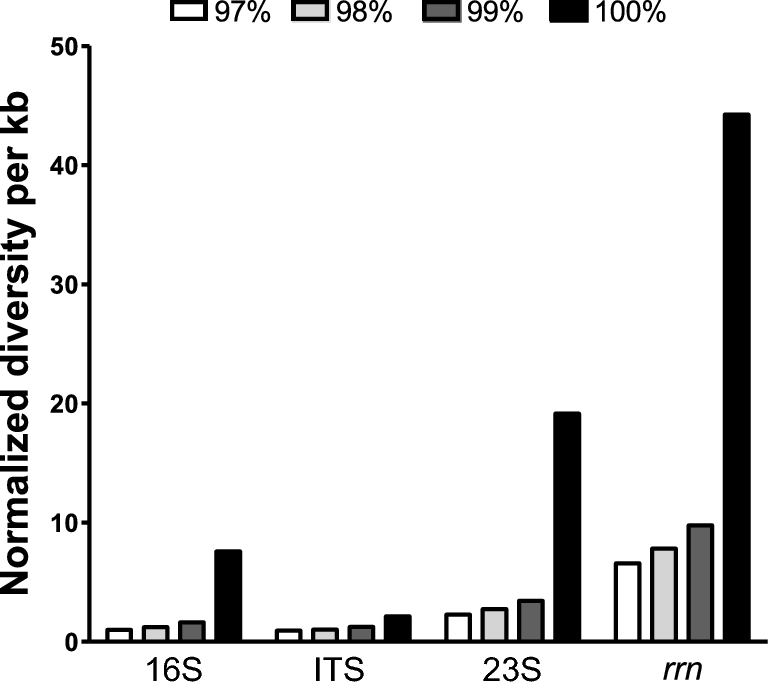
Variability of the rrn region and its functional domains. The rrn database, compiled after parsing more than 67 000 draft and complete bacterial genomes, was assessed by clustering analysis at different levels of sequence identity: 97% (white bars), 98% (light grey bars), 99% (dark grey bars), and 100% (black bars). For comparative aims, the functional DNA sequences encoded into the rrn region were also individually studied. The normalized diversity (y-axis) resulted from calculating the number of clusters obtained for each analysis, normalized with the median sizes of the respective regions in terms of kb and referenced against the value obtained for 16S sequences clustered at 97%, the canonical threshold for species assignment.