Figure 10.

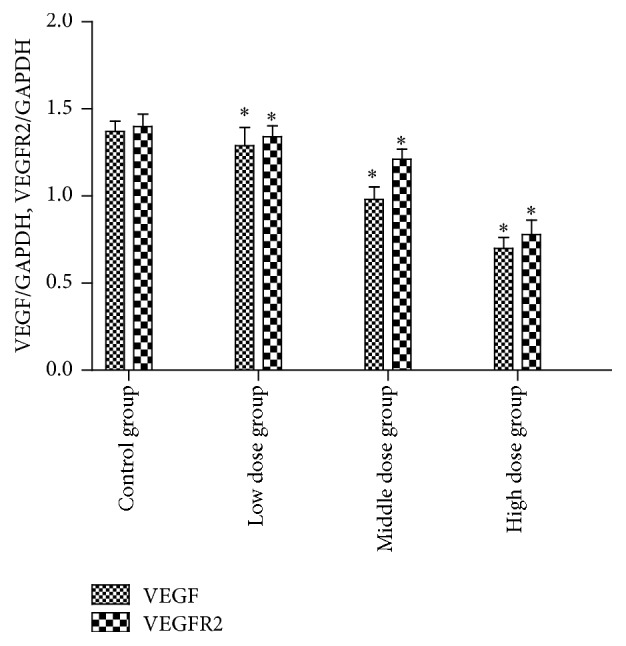
VEGF and VEGFR2 protein expression investigated by western blotting. The average densitometry values measurement of VEGF and VEGFR2 to GAPDH ratios, n = 3, x ± s, ∗ compared with the control group, and p < 0.05.

VEGF and VEGFR2 protein expression investigated by western blotting. The average densitometry values measurement of VEGF and VEGFR2 to GAPDH ratios, n = 3, x ± s, ∗ compared with the control group, and p < 0.05.