
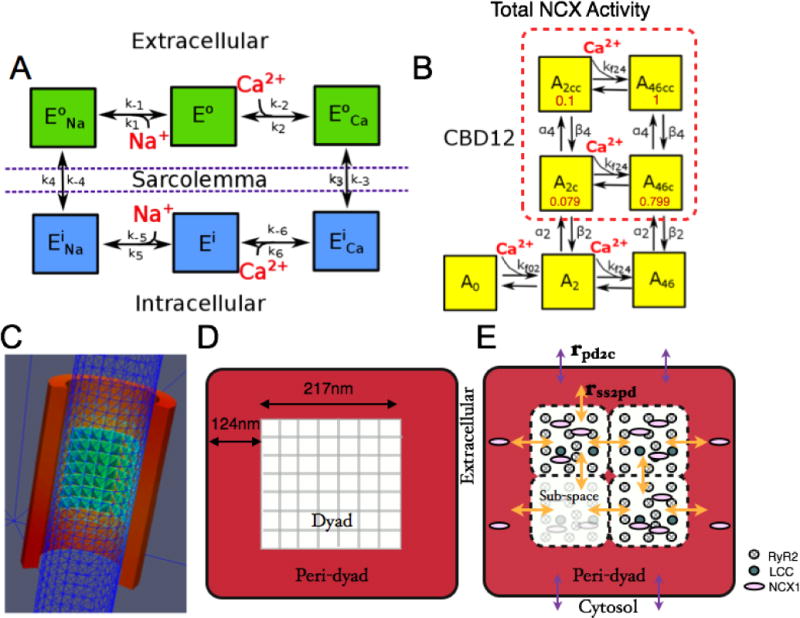
Figure 1.
NCX1 kinetic schemes and dyad model geometry. (A) State model for NCX1 transport kinetics. (B) State model for CBD12 Ca2+-dependent allosteric regulation with partial activity coefficients (red). (C) 3D mesh from SRS model [46] showing a t-tubule modeled as a cylinder (blue) partially encircled by JSR (red) containing a cluster of RyR2s (green-blue), forming a dyadic space with a 15 nm gap between these membranes. (D) Illustration of flattened JSR from the SRS model with a centered 7×7 RyR2 lattice. (E) A t-tubule-JSR cleft (or CRU) of the whole-cell model (shown in cross-section) is composed of four dyadic subspace volumes arranged on a 2×2 grid, each containing 2 LCCs and 12 RyR2s. The PD is a single compartment that surrounds the subspace grid (i.e. the dyad).