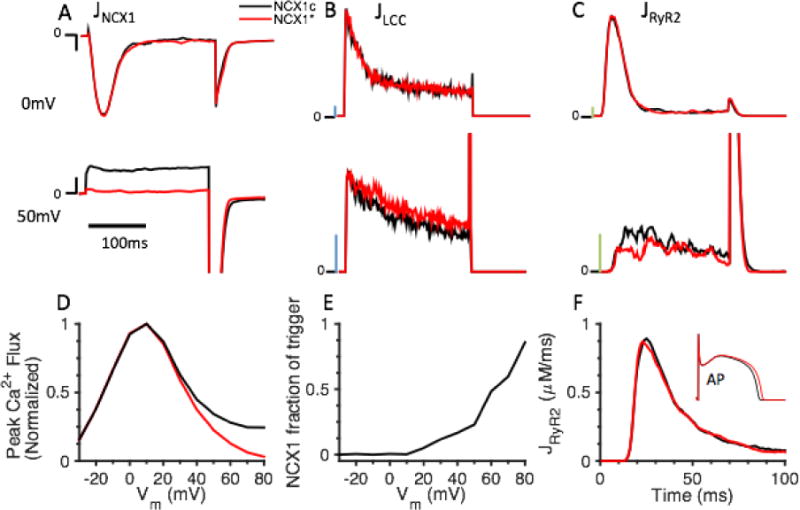
Figure 7.

The CICR triggering capacity of NCX1. (A–D) Test potentials to 0 mv and 50 mV of 200 ms duration were applied to the whole-cell model from a holding potential of −90 mV under NCX1c (control NCX1, black lines) or NCX1* (reverse mode NCX1 clamped to zero, red lines) conditions. (A) JNCX1, scale bar (black): 0.01 μM/ms. (B) JLCC, scale bar (blue): 0.1 μM/ms. (C) JRyR2, scale bar (green): 1 μM/ms. (D) Normalized peak Ca2+ influx (JLCC + JNCX1) in response to test potentials from −30 mV to 80 mV for NCX1c (black) and NCX1* (red). The results suggest that NCX1 can trigger CICR consistent with experiments [44]. (E) NCX1 fraction of CICR trigger. (F) JRyR2 during AP.
