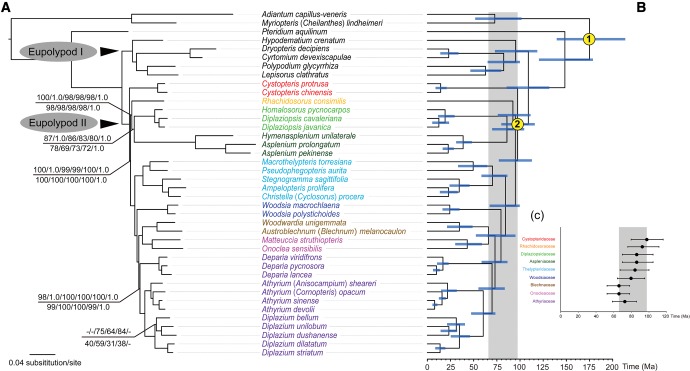
Fig. 2.—
The ML phylogram of 40 species based on 83-gene matrix and codon partitioned strategy and Bayesian divergence time estimation based on 83-gene matrix with unpartitioned strategy. (a) Maximum likelihood bootstrap values (BSs) are 100% and Bayesian posterior probabilities (PPs) are 1.0, unless otherwise indicated. Numbers above the branches indicate BSs and PPs based on whole plastome matrix, and BSs (unpartitioned, ParititionFinder, gene partitioned) and PPs based on 88-gene matrix, while numbers below the branches as BSs (unpartitioned, codon partitioned, ParititionFinder, gene partitioned) and PPs based on 83-gene matrix; (b) chronogram with secondary calibration nodes indicated by numbers; (c) bar chart indicating stem clade ages and HPD intervals of each family of eupolypods II. Blue bars indicate 95% highest posterior density (HPD) intervals of the age estimates; grey bars indicate the time-scale of eupolypod II radiation.

